The first thing we tell Graylog users is, “Monitor your disk space.”
The core set of metrics discussed below should always be in acceptable parameters and never grow over extended periods without going back to normal levels. This is why it is critical to monitor metrics that come directly from the hosts running your Graylog infrastructure.
Access and Monitor your Graylog Architecture Metrics
There are multiple external monitoring solutions available that will allow you to monitor your Graylog Architecture. Many of these tools are Open Source and provide metrics such as CPU, RAM, and storage utilization. Graylog can ingest the logs from these monitoring tools that contain details about what is causing unexpected increases in system utilization, and from there, monitoring is easy to do with dashboards and widgets. If you’re running Graylog Enterprise, you can set up alerts triggered by an event threshold when system resources are higher than expected.
For example, if you have a spike in CPU usage or latency issues with the servers, Graylog’s alerting feature will immediately let you know about increased resource utilization spike so you can identify and address the root cause, and solve the problem before it becomes out of control and difficult to manage. Let’s say a SysAdmin puts a regular expression into a Graylog processing pipeline. The expression begins to exhaust the server resources. The team receives alerts about the spike in CPU usage and they can immediately fix the expression and return the CPU usage back to a normal level before any loss of data due to lack of disk space occurred.
Free disk space is also a critical system resource to monitor in these 3 types of servers (Graylog, ElasticSearch, and MongoDB) when they are running Graylog clusters. Running out of free disk space is one of the catastrophic scenarios that can make you lose data in Graylog. There aren’t many, but this is one, the most common one. The key is to make sure the journal size and data retention settings are supported by enough disk space at all times.
The Graylog Journal
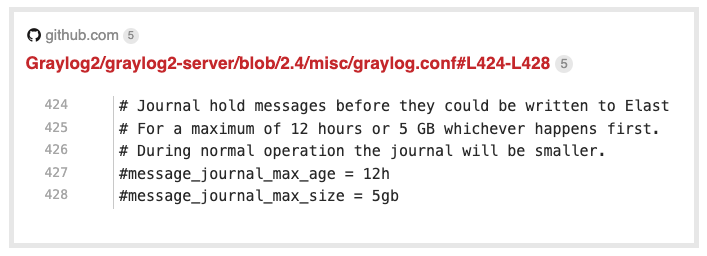
The Graylog journal is the component sitting in front of all message processing that writes all incoming messages to disk. Graylog reads messages from this journal to parse, process, and store them. If anything in the Graylog processing chain, from input parsing, over extractors, stream matching and pipeline stages to Elasticsearch is too slow, messages will start to queue up in the journal. If Graylog shuts down for any reason, the moment the application restarts, it will read from the journal. In order to prevent data loss, the disk space needs to meet or exceed the size of the journal.

For example, if you want Graylog to maintain 250 GB for a large journal, you have to make sure you have 250 GB of disk space for that journal. The breakdown usually occurs because someone forgets to change the default setting on the server, there is not enough disk space, and this usually results in journal corruption if the disk is full before the last write to the disk. The solution is to configure the journal to make sure it can never exceed the disk space. The way to do this is to make sure you have enough disk space to store the data before you tell Graylog to store it. Let’s say you want to only store 5 days of data, then you have to make sure you have enough disk space to store 5 days of data.
Monitoring and Alerting
Monitoring and alerting (for available in Graylog Enterprise) are great backstops. You can see what is happening with your servers, and Graylog can alert you before disk space is exceeded.

The Takeaway
At the end of the day, the simple answer is that you need to know immediately if you are at risk of overloading the servers hosting Graylog, Elasticsearch, or MongoDB. At a minimum, we recommend all Graylog users monitor free disk space and CPU usage. Running out of free disk space is one of the very few catastrophic scenarios that can make you lose data in Graylog. The key is to make sure the journal size and data retention settings are supported by enough disk space at all times. To prevent data loss, this means the disk space needs to meet or exceed the size of the journal. Also, as a safeguard, you will want to have monitoring and alerting in place to prevent any disk space errors.
For more on Graylog host metrics you should regularly monitor, click here.


