To review, below are the two previous posts from our security series:

An intrusion detection system (IDS) is a well-established network security technology that has different classifications, but all follow a similar pattern outlined below:
- Network packets and their data are being captured or “sniffed” in real-time when they arrive at a host or other central network location.
- This captured packet data is analyzed against known attack patterns or malware signatures.
- An alert is then triggered when an attack or other suspicious activity has been detected.
Below is an example of an alert raised by an IDS.
2016-08-07 14:33:18.528 [1:19559:5] INDICATOR-SCAN SSH brute force login attempt [Classification: Misc activity] [Priority: 3] {TCP} 192.168.128.52:64757 -> 192.168.128.157:22
This informs you of four key pieces of information:
- A SSH brute force attempt was detected at 2016-08-07 14:33:18.528
- The attack was classified as Misc activity with a priority (severity) of 3
- The brute force attempt was initiated by 192.168.128.52
- The target was 192.168.128.157 on port 22
IDS TOOLS
There are several options for Open Source IDS tools. Some very popular are:
In this post, we will be using one of the most popular IDS tools: Snort. We will be excluding host based IDS (HIDS – analyzing activity that happens within an operating system) but some of the ideas can be applied to these set of tools as well.
INTEGRATING SNORT WITH GRAYLOG
SNORT CONFIGURATION
Once you have Snort installed and configured, we will be sending the triggered alerts into Graylog.
First, instruct Snort to write all alerts to the local syslog daemon:
# snort.conf
output alert_syslog: LOG_LOCAL5 LOG_ALERT
Next, configure the local syslog daemon to forward logs to Graylog. If you are using rsyslog, it would look like the following:
$template GRAYLOGRFC5424,”<%pri%>%PROTOCOL-VERSION% %TIMESTAMP:::date-rfc3339% %HOSTNAME% %APP-NAME% %PROCID% %MSGID% %STRUCTURED-DATA% %msg%\n”</%pri%>
local5.alert @graylog.example.org:514;GRAYLOGRFC5424
You can find instructions for sending other syslog daemons into Graylog here. Note that in the above example, we are forwarding only the Snort alerts which we are writing to the local5 facility. Alternatively, you could also configure it to forward all syslog messages.
GRAYLOG CONFIGURATION
In Graylog, set up a UDP syslog input at the port and network interface you configured in rsyslog earlier and confirm that messages are arriving. For examples, you could enable ICMP IDS rules and ping a host you are monitoring with Snort to trigger an alert to arrive in Graylog.
You’ll notice that the alert information is not parsed by Graylog yet. We will set up a Graylog Processing Pipeline to identify snort logs and parse the alert into a message with extracted fields.
Below is the rule we are using:
rule “Extract Snort alert fields”
when
has
setfield(“snortalert”, true);
id”, m[“0″]);
set
id”, m[“1”]);
set
field(“classification”, m[“4”]);
set
long(m[“5”]));
set_field(“protocol”, m[“6″]);
addr”, m[“7″]);
set
addr”, m[“10″]);
set
port”, to_long(m[“12”]));
end
“`
Then, connect this pipeline to a stream with the following rules to apply to all snort messages:
# Stream “Snort Alerts”
# Rule 1:
message must match regular expression ^\s?\[\d+:\d+:\d+].*# Rule 2:
application_name must match exactly snort
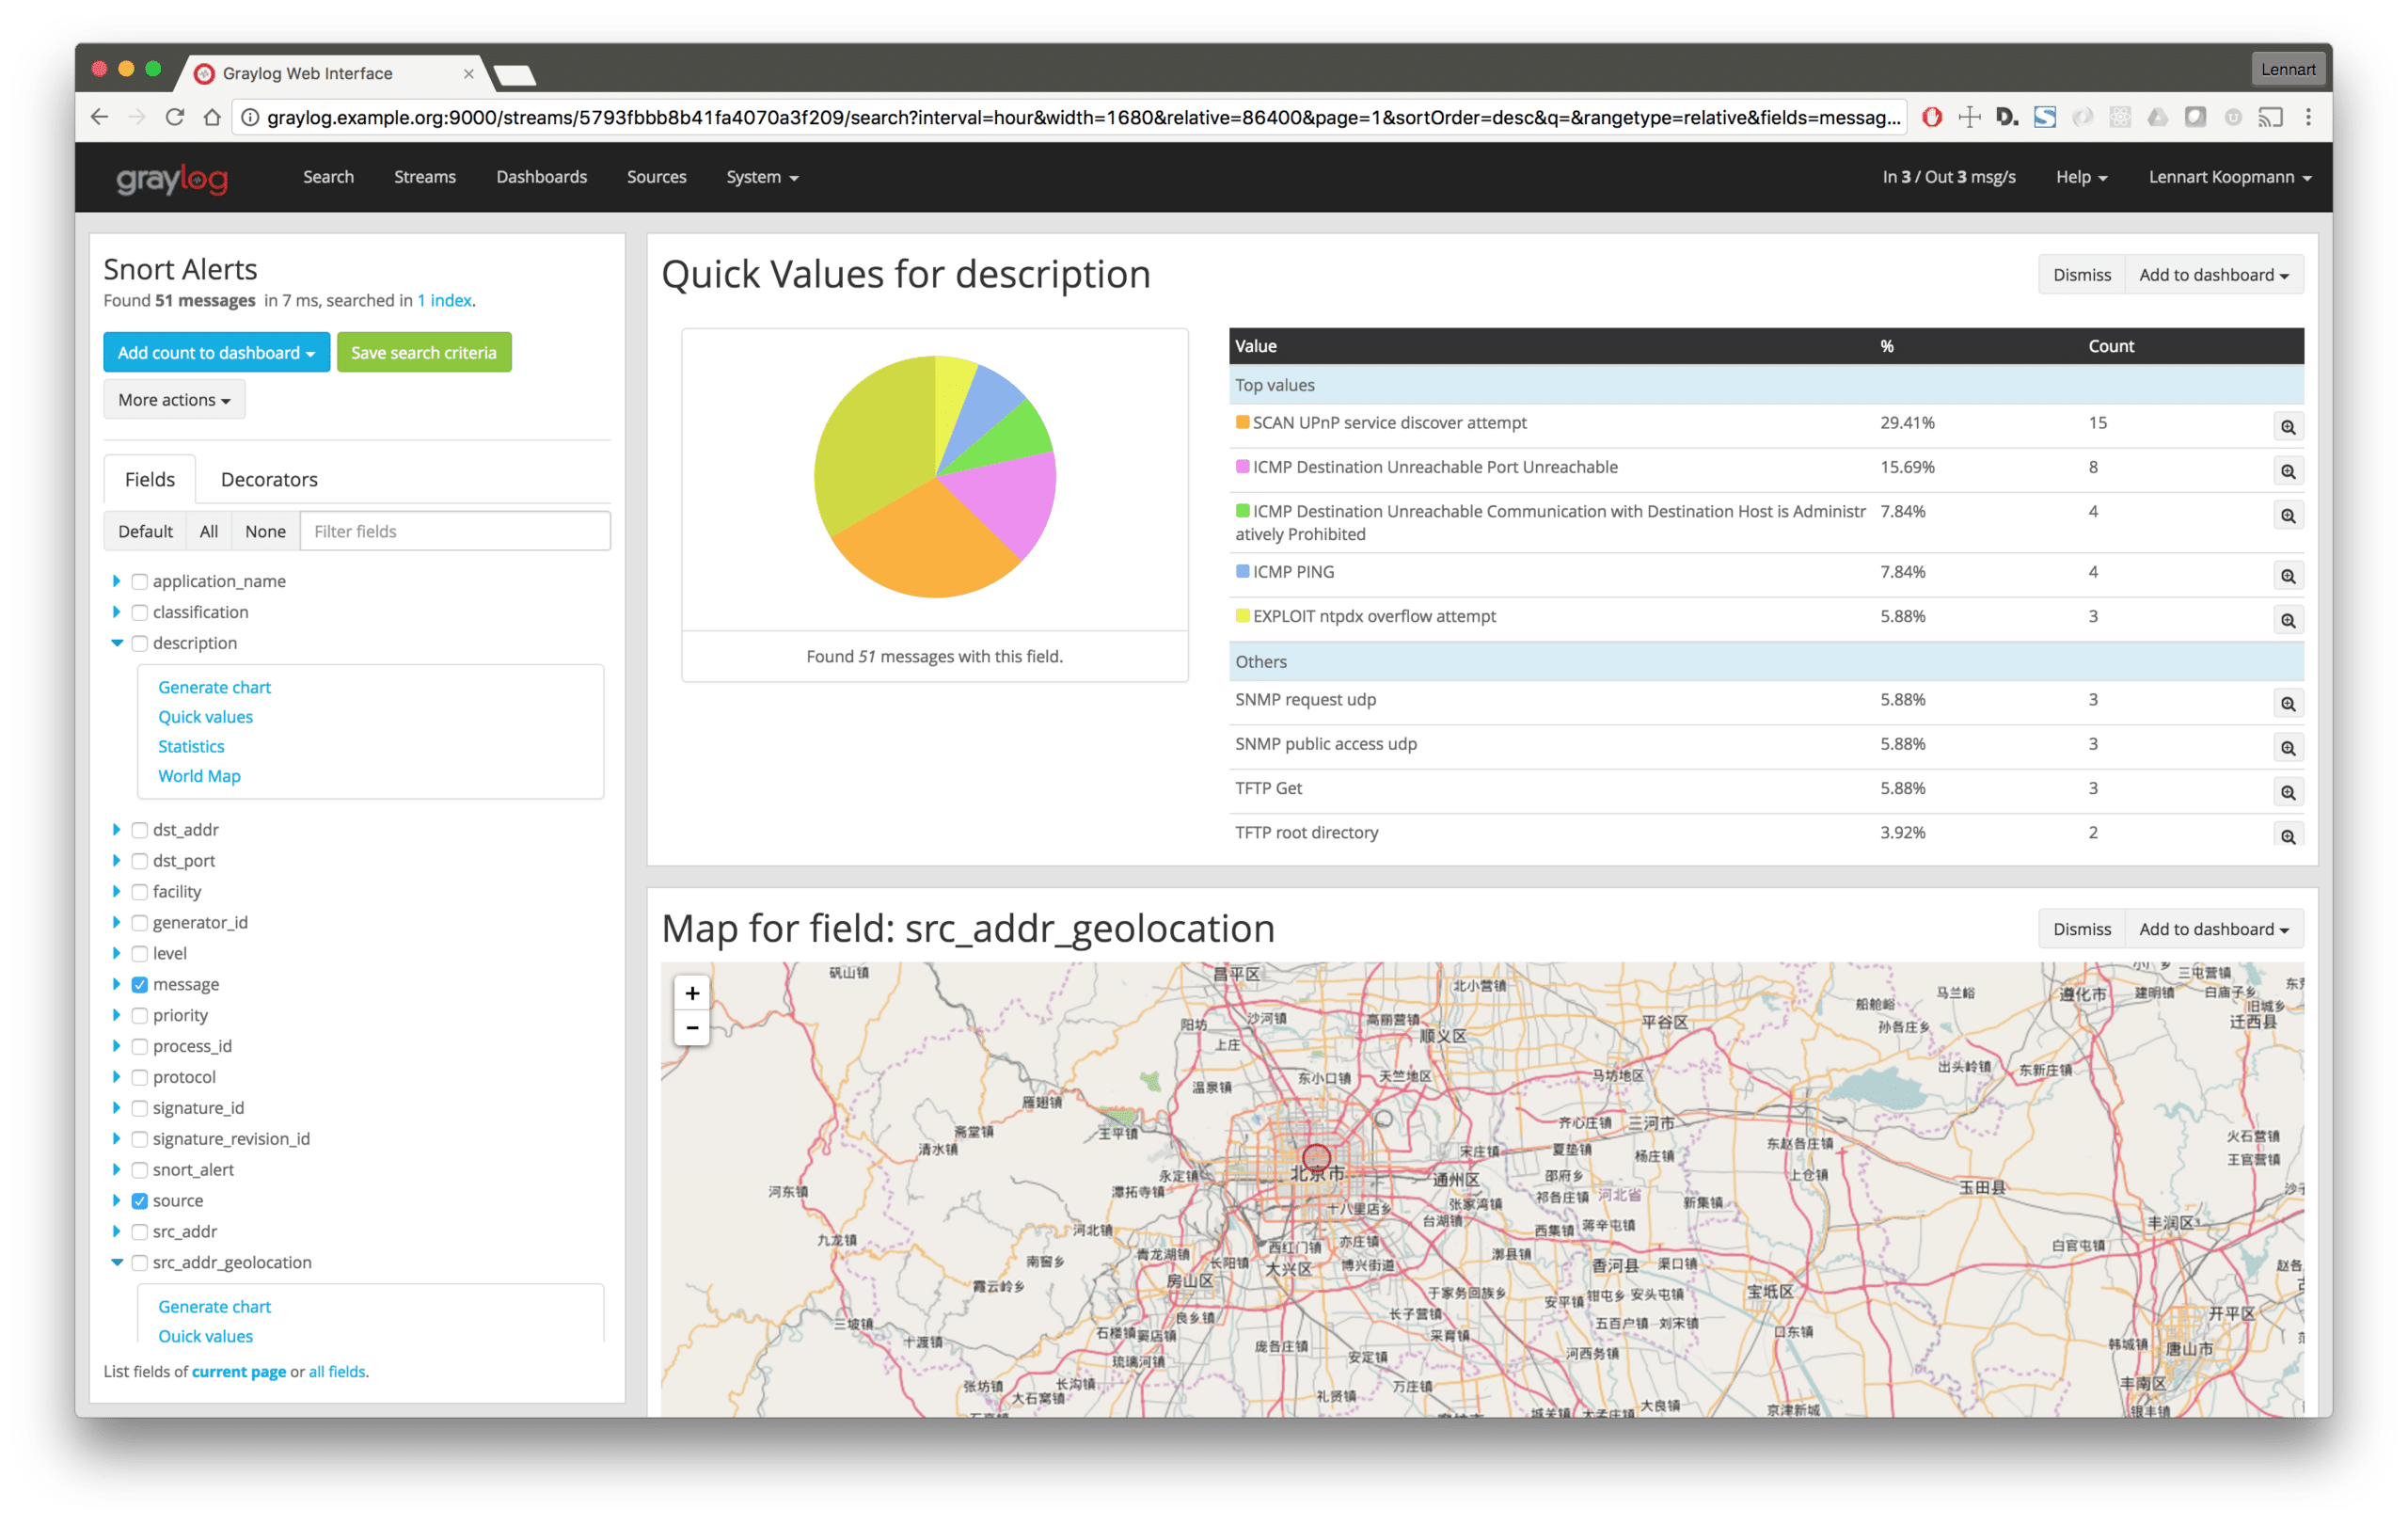
Now every new alert that arrives in Graylog will look like this:

Note the addition of the new message fields will now allow for a more powerful analysis.
In practice: Correlation to other sources
With the recently triggered Snort alerts, use Graylog’s built-in feature to obtain an overview and analyze which alerts need further investigation.

Select the alert that you wish to further investigate and copy the src_addr (IP address that triggered the alert) into a query that searches over all Graylog messages, not only the IDS alerts:
src_addr:192.168.128.52
It is important that all your sensors and sources send in source addresses in the field with the same name. The standard src_addr naming scheme is used in this example. If source addresses are being sent with differing names, analysis will become quite painful.
CORRELATING IDS ALERTS WITH NETWORK CONNECTION LOGS
A very useful source of log messages to correlate IDS logs with is network connection logs. They provide a high level overview on the IP address, time communicated, and port and protocol used.
The most popular way to collect network layer logs is forwarding them directly from your routers, firewalls and switches using a protocol like Netflow, and into Graylog. (Graylog Netflow Input)
You can read more about this topic in our previous blog post.
By searching for all connections and alerts that came from the same IP address that triggered an IDS alert, you can get the following information:

This message tells us three pieces of information:
Correlating IDS alerts with operating system logs
Imagine you are receiving an IDS alert like this:
2016-08-09 10:33:18.528 [1:19559:5] INDICATOR-SCAN SSH brute force login attempt [Classification: Misc activity] [Priority: 3] {TCP} 12.156.166.2:64757 -> 172.30.2.212:22
This explains that the IP address 12.156.166.2 tried to brute force attack our SSH service and log into the server.
If we are also sending all operating system logs into Graylog, we will be able to see a list of denied login attempts.
To do this, we need to filter by the attacker’s source IP 12.156.166.2. We could either execute a full text search, or, if we have a processing pipeline rule in place that extracts SSH login attempt IP addresses into fields, we could run a more specific search like this:
src_addr:12.156.166.2
For reference, the processing pipeline rule could look like this:
rule “SSH: Extract attempted login remote IP”
when
has_field(“message”)
then
let r = regex(“.+from (\d{1,3}\.\d{1,3}\.\d{1,3}\.\d{1,3}) port.+”, to_string($message.message));
set_field(“src_addr”, r[“0”]);
end
Let’s see what the search returns:

Uh, oh… There was a successful login from the attacker’s IP address after many failed brute force attempts.
Thanks to the IDS alert, we were able to dig deeper into the issue and detected a successful infiltration of our systems.
Build dashboards and set up alerts
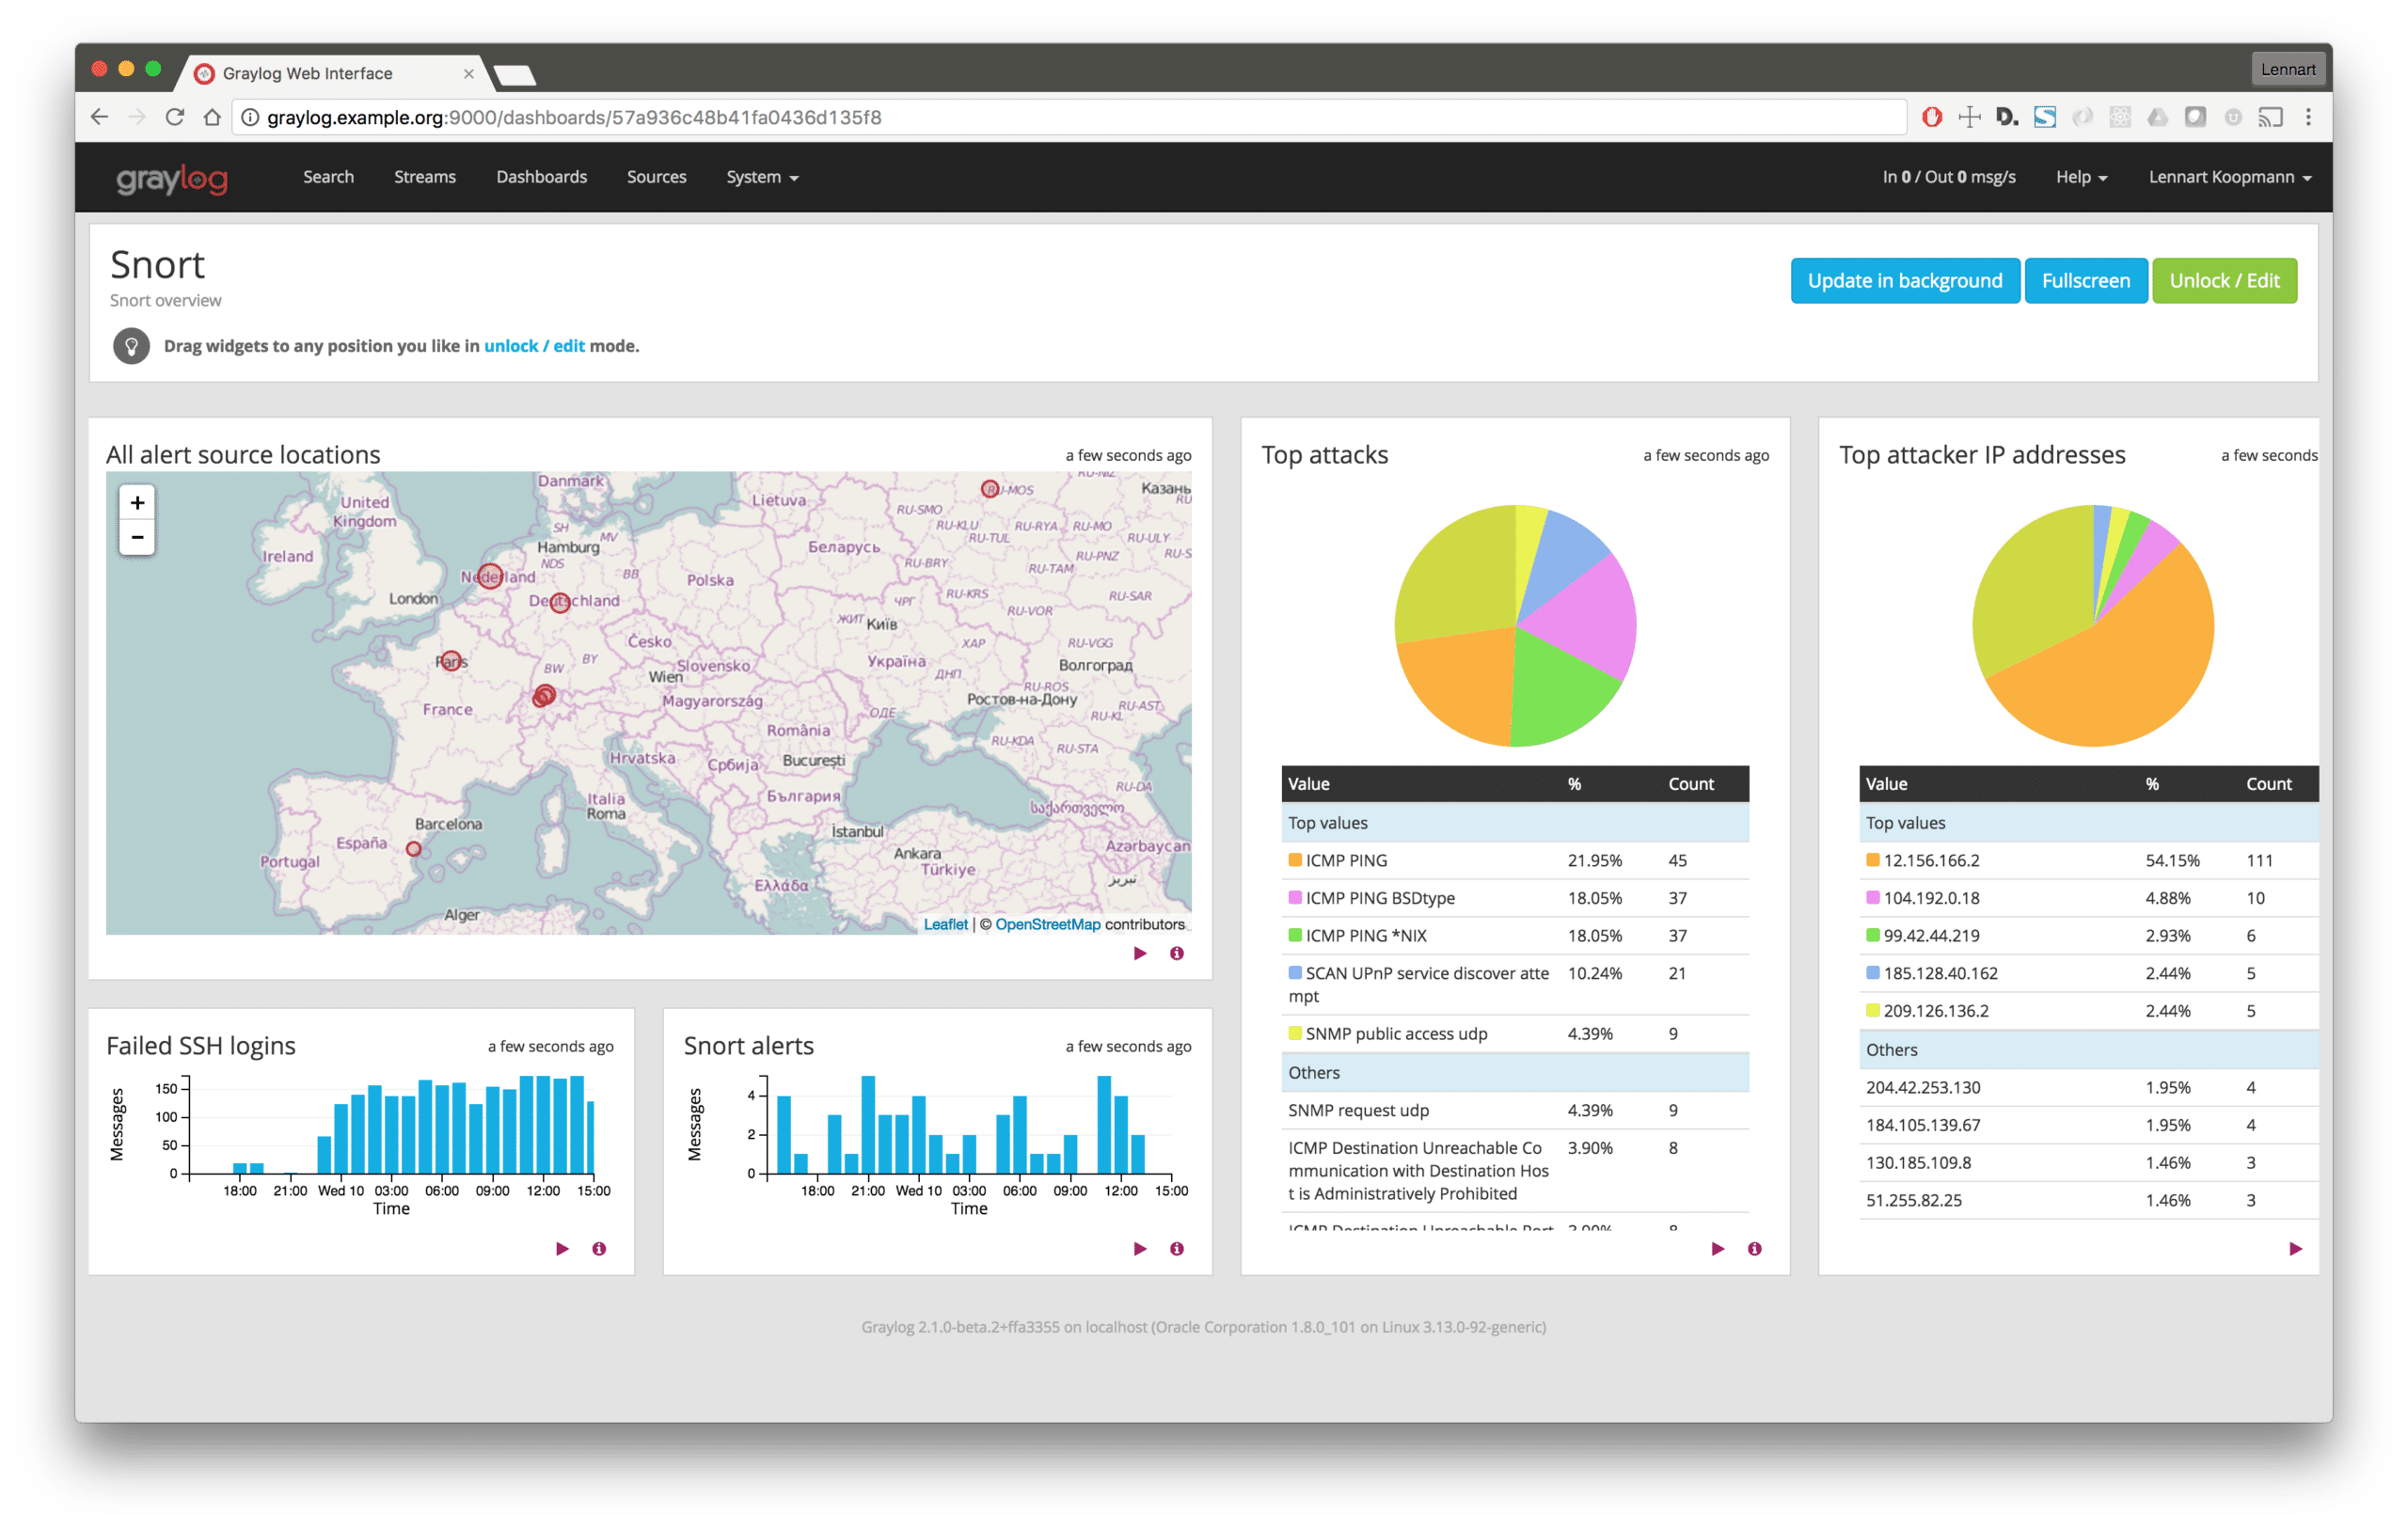
In order for easier visibility of information, a dashboard, like the one below, will provide an excellent overview.

With Graylog, you can also automatically trigger alerts like emails and Slack messages, or even JIRA tickets for high severity IDS alerts. This will allow for you to take immediate action and protect your network and system. Our final post in our three part series on security focuses on configuring IDS alerts in an open source environment. We will walk through integrating the IDS tool, Snort, with Graylog in order to detect and analyze suspicious activity. We will then provide examples of correlating IDS alerts with both network connection and operating system logs using Graylog.


