In this video guide we’re going to explain how to monitor your system by leveraging Graylog’s advanced logging capabilities. We will teach you how to check for different bottlenecks or issues that may arise, provide you with a couple of ideas on what to monitor, the commands to monitor it, and explain the different types of notifications you may receive.
Monitoring Overview
There are three principal sections that you need to monitor. The first one is the system itself which is the operating system that rides on. This can be a Linux distribution or Mac distribution. Then there’s the network side of it, that represents how you’re going to detect if there’s any issue sending in logs such as UDP packets that are getting dropped. The last one is the component monitoring, that is about monitoring Graylog and its components as well as what kind of metrics we call pull from there, and it’s the largest section.
System Monitoring
As we said before, system monitoring means monitoring the operating system. There are a few important things you want to look for.
CPU utilization
You can look at CPU utilization on a per-process basis or just the overall CPU utilization. You want to keep track of it so you’ll know when it’s spiking out. If it reaches a high CPU mark you will see that everything will slow don – processing the logs, the web interface, etc.
Memory
Memory is critical to Java – you want to keep make sure there’s plenty of memory for the Java heap stack. System memory is very important in general to make sure that the operating system, the web server, and the Graylog log processing functions have enough resources to correctly function. You want to keep an eye on memory when it gets around the 80% mark and make sure you’re getting alerts when it happens so you can expand your resources if possible.
Disk utilization
In any log management system, disk utilization is probably one of the things that fill up the fastest as the logs are collected, parsed, and enriched. Graylog writes logs to disk at two different spots: the ElasticSearch index where logs are kept for a retention period as they are collected, and the long-term archives. Here the logs are compressed to about 90% of their usual ratio and eventually moved off, but you can store them on a slower medium in the meanwhile. Because of this, you may want to keep track of disk utilization to check if the normal 30 days of space is used more than usual and your solid state drives are being filled up.
JVM Status
We want to make sure that the Java systems themselves work at all times, so we can monitor their status and check if there are CPU utilization or memory issues, if there’s a memory leak or a bottleneck. You may also want to monitor the time that is spent tracking a single process.
How to monitor your system?
You can check your system manually via command line tools like a DF (disk free) or using one of the many commercial tools available on the market. The bottom line is that you can gather all that metric data, pull it and use it to create alerts whenever something goes wrong. You can also create graphs so you can check your performance over time or when performing certain operations.
Network Monitoring
A lot of our protocols rely on UDPs to bring in those logs, so we want to make sure that we can monitor those network and keep track of them.
Protocol usage
The first commands that you can see underneath protocol usage are the netstat –us and netstat –ts. Using them will show you many different fields for both UDP and TCP. These include how many packets have been received, how many packets have been delayed, and any packet errors that you’ve collected. Using these commands lets you detect if your system can’t keep up grabbing logs and pulling them in fast enough.
You can also grab this data to graph it out over time. If you’re using tools such as Datadog or Zabbix, you can graph these performance stats and keep track of them to check, for example, if you’re having any network latency issues.
TLS Sessions
Another side you might want to monitor inside as part of your network monitoring routine are the TLS sessions. A lot of the agents now TLS as the component between the beats and Graylog or ElasticSeach. You might want to keep track of that just to make sure that the SSL handshakes are going smoothly and that there are no issues around the decryption protocols.
Component Monitoring
Component monitoring is divided into three sub-sections: Graylog, MongoDB, and ElasticSearch. Let’s have a look at them.
MongoDB monitoring
MongoDB is where we keep our covered configuration data such as the licensing issues, as well as the rules and permissions inside the product. There’s a couple commands that we recommended to use to have a better understanding of how your load is on your system. The first one there is the mongostat that will tell you how many operations are happening per second, the distribution if you have more than one box, and how they’re going to each table. This is a good way to see what’s the load and the status of your Mongo distribution.
The mongotop is just like the Linux top and provides you with information on how much write and read access you’re having on your database on a per database node. so you can see how the overall usage of Mongo DB. Now this really should never run into an issue but there are a couple commands just to monitor them.
ElasticSearch monitoring
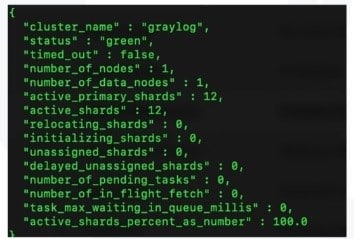
Monitoring ElasticSearch is particularly important. The first command is the curl to assess the health of the cluster. Type:
curl <ip>:9200/_cluster/health?pretty</ip>
And you’ll have it shown just like this:

When you run this cluster health status, look for the second line. If it’s green like in the above example, everything is okay. If the “status” is red or yellow then you have an issue with ElasticSearch. Maybe you’re having an unassigned shards or you’re just shown that a process has stopped in general. You may want to have a look here to find out how to fix unassigned shards.
You should always keep track when your cluster health status is outside green, and if that happens, address that as fast as possible. If you don’t, you will encounter all kind of trouble inserting new logs, indexing and rotating them around as retention times expires.
Graylog Monitoring
Graylog is a fully API based system, so all of our metrics are exposed through our API and you can pull them off very easily. Look at this curl command for example:

This should be used with the username and password of a user that does have access to these metrics, such as a common administrator. You can also create your own through the permission side of the house to have a user that can query these. Here I assumed the IP was on the local host and used this command to go through the API in the system and the metrics. I included some additional metrics that you may want to monitor.
Monitoring Internal Log Messages
The first thing you should really want to monitor are the internal log messages. These commands will help you to detect if there’s going to be a problem in here:

With these commands, Graylog exposes the internal log messages themselves in the different things that we write about our own process. They’re broken down by log level, from trace all the way down to fatal. You can do this on a 1, 5, and 15 minute increments so you can start keeping trends in time of how many errors are you getting every minute or every five minutes. If you see this trending up there’s probably a problem inside of a Graylog itself. A really good way to keep track of all these commands, is to put them on a graph through one of those monitoring tools, and then you can quickly see when you’re starting to get more problems.
Monitoring Filter execution times
The filter execution times command is great to understand if you have if you put in too many regex and grok patterns, and you’re trying to understand if any of these is slowing down your system.

The filter execution times command itself can be monitored. It does look for different performance hits that have happened already such as a regular expression that is crashing the CPU or never actually finishes itself. With this command you can monitor these issues and get the alert right away when something bad happens.
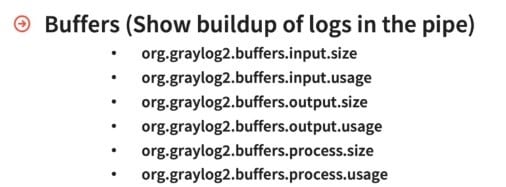
Monitoring Buffers
Buffers are understanding where logs are coming in and where they’re going out.

If you look at them, there are three sections: the input, the output, and the processing. In all three you can check the size of the buffer, which tells you how big is the buffer itself. The usage instead is where it’s at inside of that size. Maybe it’s a much smaller unit, maybe it’s not used at all, or it’s completely full.
The input buffer itself defines how fast those logs are accepted before we start processing them. The output buffer is when we take those logs right into ElasticSearch or write them off to Syslog center. The processing side is used when you get those logs in the input then they are processed – you run a regex, do an enrichment, or a threat intelligence lookup.
Buffers are a really good metrics to keep track of so you know if you’re getting any buildup of logs, or if there’s a bottleneck or a slowdown as they are processed.
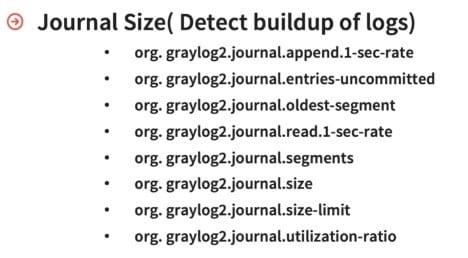
Monitoring Journal size
The last thing you want to monitor is the journal size. In Graylog we have a journal (default size is 5 gigabytes) where all incoming logs are spooled and then written to disk. Graylog uses this journal to parse, process, and store all messages.

So there’s a whole bunch of different metrics that we can detect around the journal size. The first one is how many append occur at one second rate, to check if there’s something that is causing the journal to increase really fast. Usually this points to some process being broken. We can also look for uncommitted entries, which indicate that we’re not being able to write the logs to the disk itself and process them down.
You can keep track of all these parameters and graph them over time to have an in-depth understanding of how Graylog is parsing, processing, and storing those logs. These metrics would then show you if there’s something is building up from the input side, the processing side, or the output side when writing messages to a ElasticSearch. And if any one of those main components are down you’ll start seeing cues in this journal as they’ll keep growing over time.
Additional console features
Graylog’s console offers you additional features that will help you monitor your whole system and keep everything under control.
Overview
The first one can be found under the “System” menu in the “Overview” section. Here you will find a quick and good representation of what to look for. For example, you can find the health of the ElasticSearch cluster and check whether its status is green, yellow, or red. You can also check if there’s any indexing failure such as any gap as Graylog grab the logs and writes them to disk.
Nodes
The second section is the “Nodes” one that helps you keep track of the JVM usage of each node. The moving bar will bounce left to right as the normal Java cleanup process happens. Clicking on the individual node you can look at other things such as the metrics for the input, output and process buffers. A nice visual representation will tell you how full they’re getting as well as the heap usage. On the very top, you can quickly check if everything is running correctly and that everything is marked alive.
If you click on the metrics, you can see them in deeper detail in a new tab. For example, you can see how fast you’re getting incoming messages, the input size, its usage, etc. In the “Actions” section, you can check API browser itself and look through all the different API that you have, or open up a huge list of metrics you want to monitor.
Conclusion
If you want to find more information, check this about the metrics that we monitor in Graylog. You can also check a post in our community about Disk journal monitoring that is also really helpful. Once again, thanks for watching this video and reading this post, and happy logging!

