Note: This document is for Graylog Server v3.0 or later (to find out the latest version of Graylog, click here) and Graylog Content Pack: Standard Lookup Tables and Processing Pipeline Rules for Security rev 5 or later.
Monitoring all DNS requests in your network, including those that were blocked by (e.g., by a firewall) is a great way to increase visibility, enforce compliance and detect threats.
A common problem with collecting DNS logs is that DNS server logs are notoriously hard to parse. Also, parsing only the logs of your DNS servers leaves a blind spot when it comes to usage of, or the attempt to use, an external DNS server like Google’s 8.8.8.8.
This content pack for Graylog takes a different approach: Using strategically placed sensors, we read data right off the wire. This way of collecting DNS logs guarantees interoperability with any DNS request, even if it is going to an unexpected DNS server or if it was blocked somewhere further down the path.
COLLECTING THE DATA
For collecting data off the wire, we are using Packetbeat. Packetbeat is listening on any network interface you want it to and parses out any DNS traffic. It can also handle other types of network traffic, but for this guide, we are talking about DNS traffic only. Packetbeat also waits for possible answers of a DNS server and enriches the request information with details about the response. The result is a complete DNS event that went over the wire.
Packetbeat can forward the events to many endpoints. Graylog has a native Beats input that can read the data sent by Packetbeat. Note that Packetbeat calls the format that Graylog expects the “Logstash” Format.
Here is an example packetbeat.yml configuration file that collects all DNS events that pass through any network interface and sends them to a Graylog Beats Input at graylog.example.org on (TCP) port 1544.
packetbeat.interfaces.device: any
packetbeat.protocols:
– type: dns
ports: [53]
include_authorities: true
include_additionals: true
output.logstash:
hosts: [“graylog.example.org:1544”]
STRATEGICALLY PLACING THE PACKETBEAT SENSORS
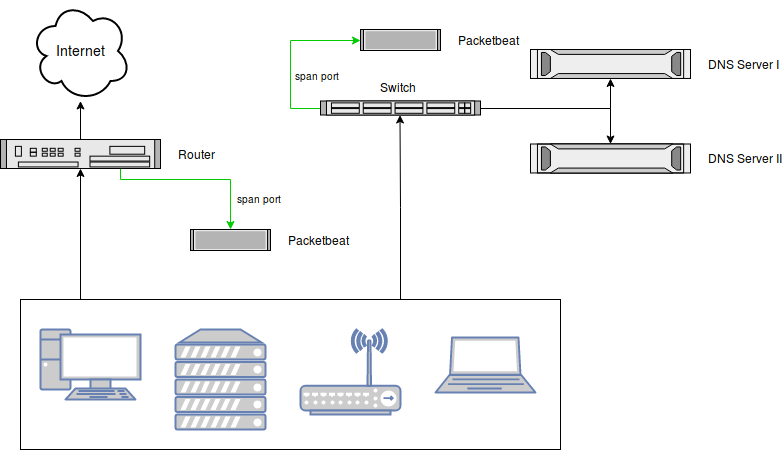
It’s up to you where you want to place the sensors, but we recommend using span ports and placing one at each egress point of your network and one in front of each internal DNS server you might be running.
Think about how to catch all DNS requests and responses, no matter if they go to a legitimate or illegitimate DNS server.

Note that you can also run a Packetbeat sensor on the DNS servers themselves, have them listen on the local interface that receives and answers DNS requests, and not use a span port at all. It depends on your use case.
INCLUDED CONTENT
(NOTE: Note: the information below is Graylog Server v3.0 or later and Graylog Content Pack: Standard Lookup Tables and Processing Pipeline Rules for Security rev 5 or later.)
The content pack (details about Content Packs) relies on these default lookup tables to be set up and functioning:
- DNS Threat Intelligence (abuse-ch-ransomware-domains)
- IP Address Threat Intelligence (for example: abuse-ch-ransomware-ip, tor-exit-node-list or spamhaus-drop)
- GeoIP (geoip)
- DNS Reverse Lookups (dns-reverse-lookup)
The content pack ships these additional lookup tables:
- Popular Domains (popular-domains)
- Top 1M popular domains, based on the free Cisco Umbrella dataset.
- Great to identify DNS requests for uncommon domains. A common Threat Hunt is to look at the least commonly requested domains, and this lets you avoid, for example, trusted domains like netflix.com or google.com that are not relevant.
- The attached script fetch_dns_threatintel.sh should be used to fetch and format the underlying CSV file that Graylog can read.
- Dynamic DNS Domains (dynamic-dns-domains)
- Threat actors often use dynamic DNS hosts (like, for example, dyndns.org) to establish command and control channels. We use this list to indicate if a requested DNS request belongs to a dynamic DNS hoster.
- The attached script fetch_dns_threatintel.sh should be used to fetch and format the underlying CSV file that Graylog can read.
- GeoIP Database (geoip)
- add Geo Information about Countries and more.
- Use the geoipupdater to get always the latest Version
If you don’t want to use any of these lookup tables, please disable the respective lookups in the DNS Processing Pipeline.
INPUTS
The content pack creates a Graylog Beats input that listens on the listen_address and port that you configure when you apply the content pack.
Point your Packetbeat DNS sensors to that input. Only send DNS events to this input. Create a different input if you decide to use Packetbeat for sniffing other protocols. The underlying stream and processing of this content pack expect only DNS events recorded by Packetbeaet at this input.
STREAMS
The content pack creates the following streams:
- DNS Requests
- All DNS requests recorded by your Packetbeat DNS sensors.
PIPELINE RULES FOR PARSING AND ENRICHMENT
The included Processing Pipeline DNS requests performs the following top-level actions on the data received by the included Packetbeat message input:
- Removes unnecessary fields from the received DNS event and mutates the field names to follow the Graylog schema.
- Identifies if the source or destination address of the DNS request is an internal or external (internet-routable) IP address according to RFC1918 and sets fields like src_ip_is_internal [boolean]. Later, these fields are used to identify if the DNS request goes to an internal or external DNS server like Google’s 8.8.8.8.
- Runs threat intelligence lookups for the query (foo.bar.example.org) and the query base (example.org). Adds fields like query_threat_indicated [boolean].
- Runs threat intelligence lookups for the destination IP address. Adds field dest_ip_threat_indicated [boolean]
- Runs a GeoIP lookup for the destination IP address. Adds field dest_ip_geolocation [string]
- Compares the query and query base against the lists of top 1M popular domains and known dynamic DNS hosters. Adds fields like query_popularity [long] and query_base_is_dynamic [boolean].
- Runs reverse DNS lookups against the source and destination address of the DNS event. This additional information helps to identify hosts without guessing IP addresses. For example, dest_ip:172.16.0.10 would have the field dest_ip_domain:corp-dns-01 added to the same event.
ALERTS
The content pack includes the following alerts (details about alerts), sitting on top of the shipped DNS Requests stream:
- DNS: Base64 encoded data detected
- A part of the DNS query resembled a Base64 encoded string.
- DNS: Cobalt Strike Beacon detected
- A DNS query resembled a Cobalt Strike beacon. Cobalt Strike is a tool to establish covert command and control channels.
- DNS: Request for Dynamic DNS Domain detected
- We recorded a DNS request for a dynamic DNS domain. Threat Actors often use these domains.
- DNS: Request for Telegram API detected
- We recorded a DNS request related to the Telegram Messenger API. Threat Actors have used Telegram for command and control channels.
- DNS: Request to unexpected DNS Server detected
- We recorded a DNS request to an unexpected DNS server. An expected DNS server is the server that you want your users to use and could be an internal or external IP address. See the installation instructions of this content pack for how to configure your list of expected DNS servers.
- DNS: Threat-Intelligence-Flagged Request detected
- A DNS query is on a list of known Threat Actor-related domains.
Do you have another alert that is not included by default? Please reach out to us. We’d love to help you build it and include it in this content pack.
We have based some of the alerts on the Sigma Ruleset by Florian Roth and all Sigma contributors.
DASHBOARDS AND REPORTS
The content pack includes the following dashboards and reports:
- Dashboard: DNS: Summary
- Report: DNS: Summary
Both the dashboard (details about dashboards) and the report (details about reporting) are sharing the same widgets:
- Number of DNS Requests (req/min)
- Spot anomalies in DNS request frequency.
- Clients attempting to use Unauthorized DNS Server
- Find hosts that are making or attempting DNS requests to unexpected or unauthorised DNS servers.
- Least Common DNS Requests
- A list of the least common DNS requests, filtering out all popular domains.
- Mean DNS request size (bytes), Mean DNS response size (bytes)
- Spot anomalies in the mean request and response size to find hints of data exfiltration or command and control channels.
- Requests for Threat Intelligence-flagged domains
- Requests for Dynamic DNS domains
Note that reports are using dashboard widgets to display data. Deleting or changing dashboards can have side effects on reports. If in doubt, create a new dashboard.
BUILDING SEARCH RESULTS AND DASHBOARDS
Currently, content packs cannot ship pre-built search results or dashboards (details about Dashboards). Until this is supported, here are some screenshots and examples to get you started:

GETTING STARTED
Open the Search Page (included in Graylog Enterprise) and select the DNS Requests stream in the stream selector. Doing this limits the result set to only DNS request events. Also, select a broader time range like last 1 day to look at more DNS requests.
To create a dashboard that we can work with, click on the triple dots in the top right corner, then select Export to Dashboard. This will export your search results to a new Dashboard. You can edit the dashboard and add additional widgets to it if needed. To save your new dashboard, click on the Save As button, give the Dashboard a title, then click Save.
DNS SUMMARY VIEW
DNS Servers in use
If you expect all your devices and hosts to use a specific, possibly internal DNS server, you should monitor if someone tried to access unexpected DNS servers, too. Such requests can happen accidentally, by misconfiguration or by malicious actors.
Luckily, we can build a list of used DNS servers in Graylog very easily:
- Find the field dest_ip (the destination address of the DNS request) in the sidebar, click on it and select Aggregate.
- A new widget appears, showing a list of all destination addresses of all DNS requests.
- Double click on the widget title and give it a more suitable title, like “DNS Servers in use”.

Sum of DNS request and response sizes (bytes)
Anomalies in the size of DNS requests and responses can indicate unusual behaviours like a command and control channel or DNS exfiltration. Note that this is a comparably weak detection method, but still interesting data to have available.
In this example, we are looking at the total size of all DNS requests made, but you should also consider looking at, for example, the min(), max() or stddev() values to increase visibility and your chance to detect unusual behaviour.
Here is how to create the charts: (repeat the procedure for the response_bytes chart)
- In the sidebar, find the field bytes_in, click on it and select chart.
- A new widget appears, which displays the average avg(bytes_in) value of the field.
- Edit the widget and add a new metric called sum(bytes_in) on the left hand side of the aggregation builder.
- Delete the avg(bytes_in) metric.

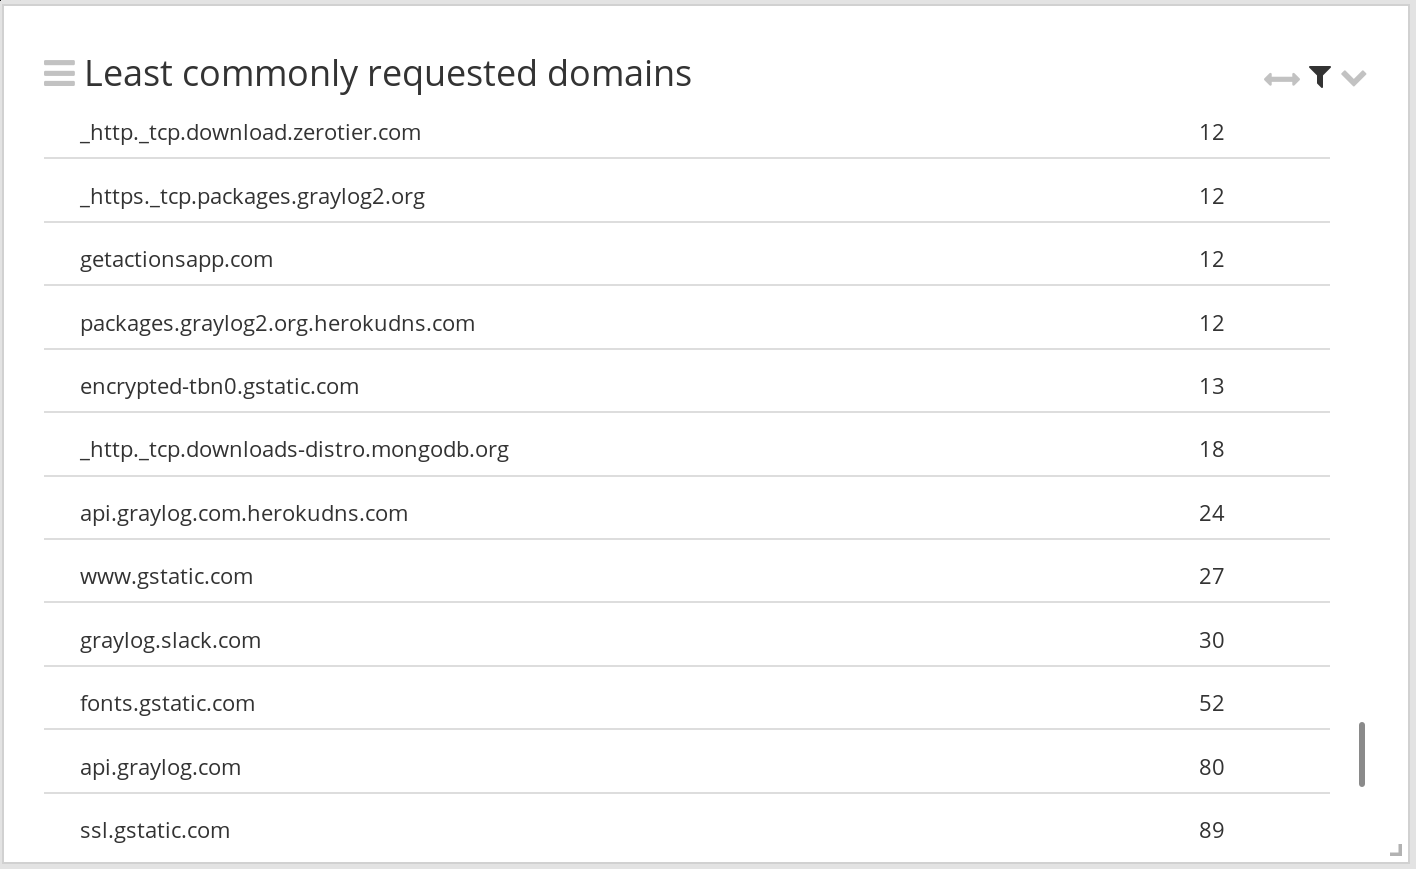
Least commonly requested domains
A common threat hunt is to look at the least commonly requested domains. With the help of the Popular Domains lookup table, we can also filter out popular domains that we are not interested in.
- Find the field query in the sidebar and glick Aggregate.
- A new widget is created, showing the most commonly requested domains
- We need to change the sorting to see the least commonly requested domains. Edit the widget, and in the aggregation builder, change the sorting to Ascending count().
- Edit the widget filter and set it to query_popularity:0 AND NOT query:*.localdomain AND NOT query:*.in-addr.arpa AND NOT query:*.ip6.arpa to filter out popular domains and other unwanted traffic.

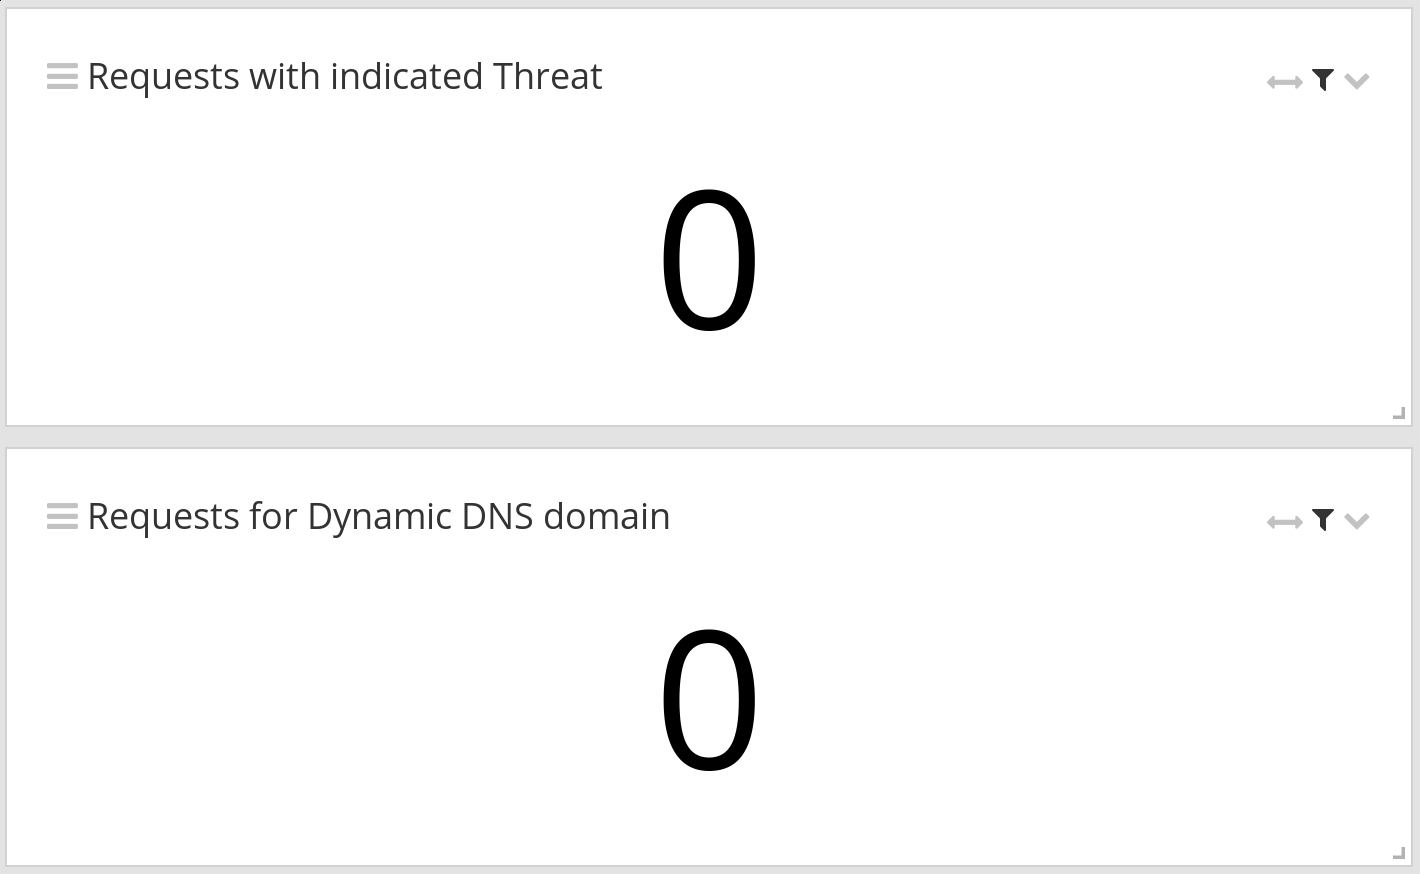
Domains with indicated threat and requests for dynamic DNS domains
Graylog compares the recorded DNS requests against threat intelligence lists. We can add a count of TI-flagged requests on a view with just two steps:
- Use the Create button at the top of the sidebar and select Message Count.
- The resulting widget shows you the total number of DNS requests. Add a widget filter to only count TI-flagged requests: query_base_threat_indicated:true OR query_threat_indicated:true
- Do the same for a widget that shows the number of requests for dynamic DNS domains, using the following filter: query_base_is_dynamic:true

DNS Domain Investigation
A commonly repeated task could be to learn more about domain or hostname during incident response or research. To make this as easy as possible, you can create a new view, limit it to the DNS Requests stream and use the following query:
query:$query$ OR query_base:$query$
This will create a parameterized view like this:


Now other people with access can easily investigate different domains or hostnames just by changing out the parameter.
Installation
For general content pack (details about Content Packs) installation instructions, please follow the main README that you should have received together with this document.
There are a few manual steps you have to perform after installing this content pack:
- Edit the underlying query of the “Clients attempting to use Unauthorized DNS Server” widget on the “DNS: Summary” dashboard to use the dest_ip (or multiple addresses) of the DNS servers you expect your machines to use.
Edit the underlying query of the “DNS: Request to unexpected DNS Server detected” alert condition to use the dest_ip(or multiple addresses) of the DNS servers you expect your machines to use.


