Even before the push to the cloud, your company was a Microsoft shop. From workstations to servers, you’ve invested heavily in the Microsoft ecosystem because it gave your business all the technologies necessary for success. As part of your organization’s digital transformation strategy, Azure offered the easiest onboarding experience. With its capabilities for building, testing, deploying, and monitoring applications and services, Azure’s cloud platform enables you to quickly and easily scale your digital strategies.
Simultaneously, Azure’s cloud model brings its own set of problems. With more Software-as-a-Service (SaaS) applications connected to your Azure deployment, you expand the attack surface and increase your environment’s complexity. Meanwhile, the ability to rapidly scale up services can create cost management challenges.
With robust Azure monitoring, you can optimize operations, control costs, and monitor security more efficiently.
What is monitoring in Azure?
Azure monitoring means collecting, aggregating, correlating, and analyzing health, performance, and security data from across the applications and resources deployed in the platform. Monitoring Azure enables IT operations teams and security analysts to gain insights into application and infrastructure behavior, including:
- Identifying and resolving performance issues
- Monitoring resource usage
- Detecting security threats or vulnerabilities
The Azure platform will provide the following logs that IT and security teams use when monitoring their infrastructure:
- Resource logs: operations performed within an Azure resource (data plane), like making database requests or getting secrets from key vaults
- Activity logs: operations performed on an Azure resource in the subscription from the outside (management plane) that identify who did what and when thy took action
- Microsoft Entra logs: history of sign-in activity and audit trail for changes made in Microsoft Entra ID
By centrally aggregating these logs, operations and security teams can monitor important metrics like:
- CPU usage
- Memory usage
- Response times
- User logins
- Failed logins
- Number of connections
By capturing this data, organizations can create alerts to identify performance or security issues before they lead to business interruption or a data breach.
Azure Monitor: The Pros and Cons
Microsoft offers Azure Monitor, a comprehensive monitoring services that enables customers to collect and analyze logs from various sources, including data from:
- Azure Tenant
- Azure subscription
- Azure resources
- Guest operating system
- Application code
- Custom sources
However, since Azure Monitor is an additional subscription fee, organizations should understand the benefits and drawbacks.
Benefits of Azure Monitor
As the native Microsoft technology, Azure monitor offers significant benefits, including:
- Tracking Azure resource usage
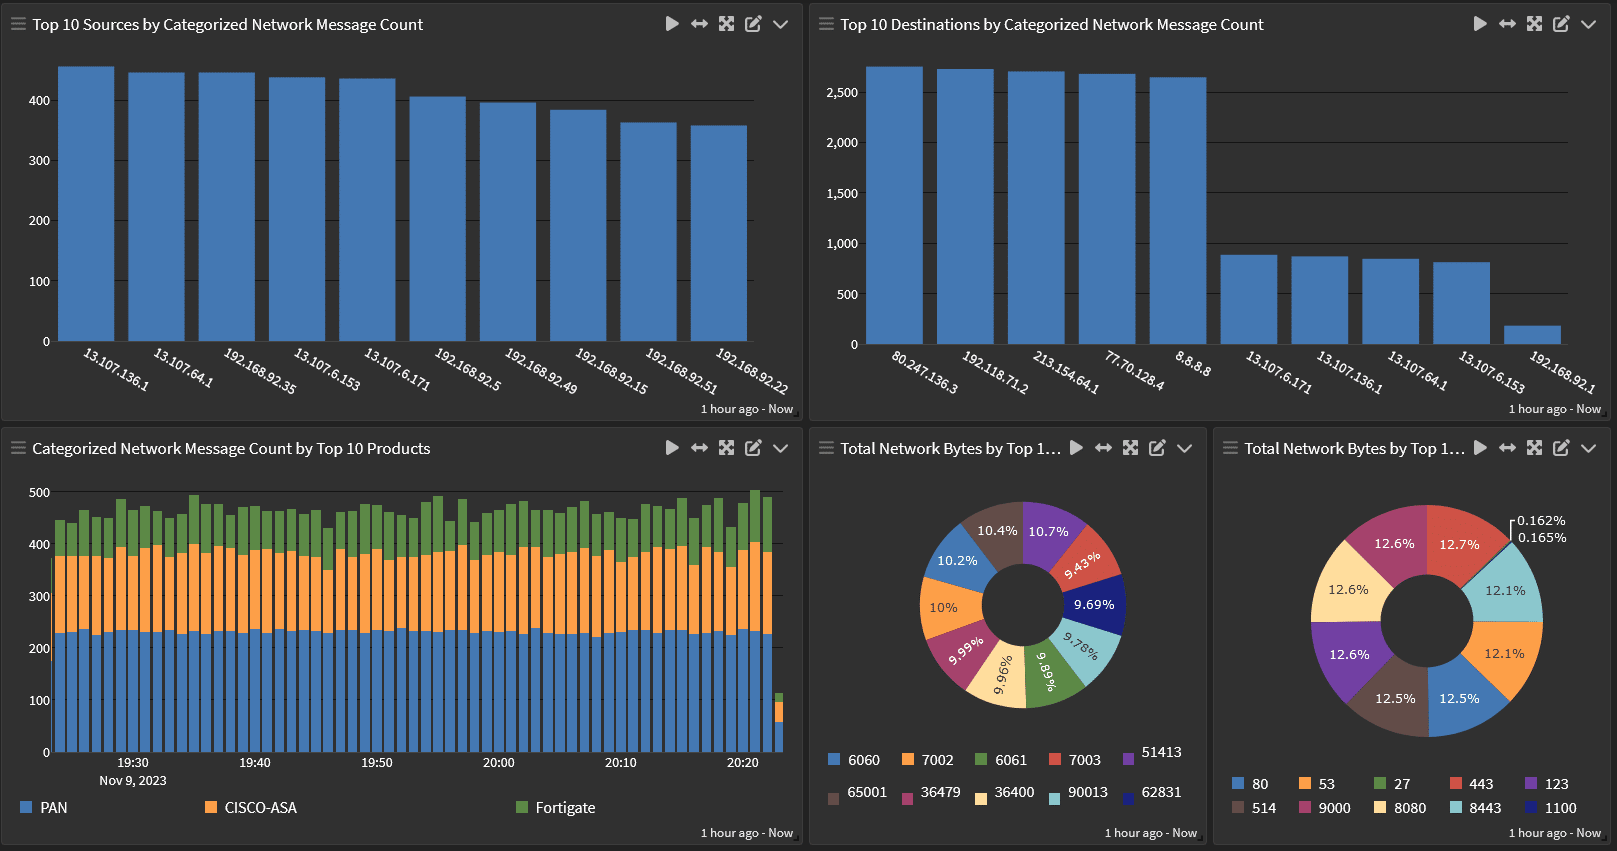
- Providing a single dashboard that combines all data, metrics, and logs
- Visualizations, including charts and graphs for insights into resource performance
- Application Insights, built-in metrics for understanding resource use, including inbound and outbound data, state, and application performance
- Easy-to-create alerts
- Azure Log Analytics for managing and monitoring log data associated with resources connected to Azure
- Alerts and notifications through email, SMS, and dashboard for troubleshooting
Drawbacks of Azure Monitor
Despite its popularity, Azure Monitor has some drawbacks, including:
- Inability to monitor resources at the application level
- Limited conditions for alerts
- Limited types of notification channels
- Inability to monitor serverless applications
- No consolidated reporting on Azure resources
- Lack of state and threshold monitoring
- Potential for vendor lock-in
Centralized Log Management: Azure Monitoring in a Multi-Cloud Environment
If you’re like most organizations, you have a multi-cloud environment that includes Azure plus Amazon Web Services (AWS) and/or Google Cloud Platform (GPC). Each cloud provider offers its own monitoring solution, but those tools may not always play well together. With centralized log management, you can break down these silos for effective, efficient IT operations and security monitoring in a complex cloud environment.
Parse and Normalize Log Data
Each cloud platform has its own log schema, making it difficult to correlate data across a complex multi-cloud environment.
Consider the following examples of how the different providers name the fields containing user information:
- Azure: identity
- AWS: accountId
- Google: principalEmail
Although each of these fields identifies the person or service accessing the resource, the way they format that data differs.
Additionally, monitoring Azure appropriately requires collecting data from:
- Azure Active Directory (audit and sign in logs)
- Azure Audit
- Azure Network Watcher
- Azure Kubernetes Service
- Azure SQL
With a centralized log management solution that extracts, or parses, the fields you need, you can apply a standardized schema, or normalize, the fields. By aggregating and normalizing this data across your hybrid or multi-cloud environment, you can make correlations across previously siloed data points.
Correlate Application, Network, and Identity Data
Whether you’re trying to identify the root cause of an application error or manage application security, a centralized log management solution with security analytics gives you the data you need across a multi-cloud environment. Additionally, since the centralized log management solution enables you to aggregate and correlate all application log data, you eliminate vendor lock-in while gaining enhanced business application insights.
Your centralized log management solution can aggregate and correlate data from:
- Network devices
- Firewalls
- Applications
- Identity and access management (IAM) tools

With the data aggregated and correlated in one location, you can identify operational issues or security incidents faster.
Identify Normal and Abnormal Resource Usage
The ability to scale resources on demand is often a selling point for companies moving to the cloud. However, managing cloud costs becomes overwhelming, especially when you don’t know what “normal” resource use looks like.
Centralized log management enables you to optimize cloud costs by providing insights into:
- Underutilized resources, like CPU usage, load balancers, virtual machines
- Metrics for autoscaling and rightsizing, like disk read/write, API call logs, and firewall logs
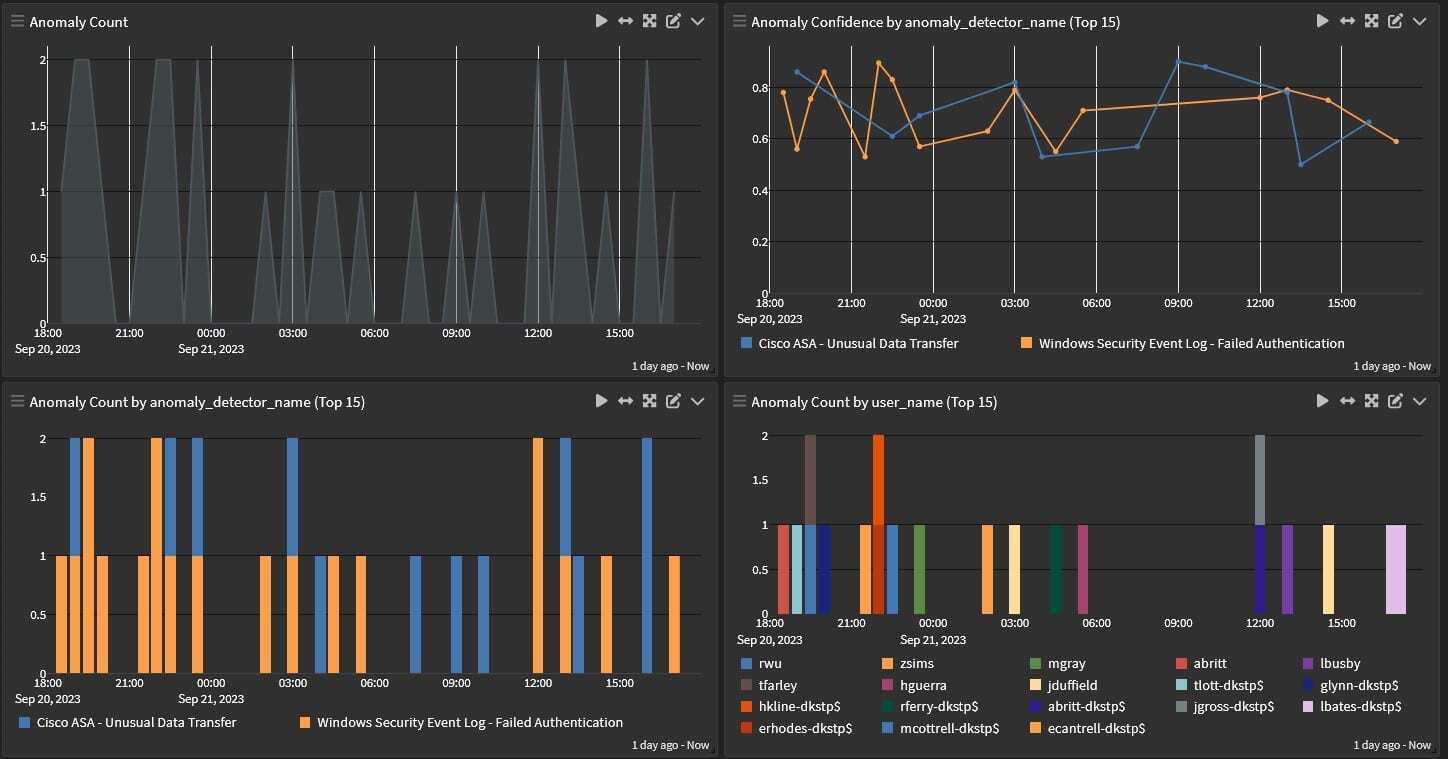
Further, you can use the same metrics to identify anomalous behaviors that could indicate a security incident. For example, if you see high volumes of outbound traffic from a resource, this could indicate malicious actors sending sensitive data to a command and control server.
Reduce Noise with High-Fidelity Alerts
With centralized log management, you can gain the full value of your data. With the ability to normalize data across divergent technologies, you can build high-fidelity detection rules that correlate various factors across your environment.

By enriching your data, your teams get fewer – but more meaningful – alerts. This process enables them to spend more time on what matters, keeping your operations running and protecting your environment.
Collaborate Efficiently Across Operations and Security
With centralized log management, your IT operations and security teams work from a shared data set. Although they can create different dashboards that respond to their use cases, they can collaborate more effectively by sharing those with each other.
For example, a slow network can be an operations issue, like a misconfigured network device, or a Distributed Denial of Service (DDoS) attack. When IT operations and security teams have access to the same data across a complex environment, they can trace an issue’s root cause faster, improving key metrics like mean time to investigate (MTTI) or mean time to remediate (MTTR).
Graylog: Operations and Security Information for Monitoring Azure
With Graylog, you can build a single source of log information that enables observability and visibility across a complex environment. Graylog ingests all log data, no matter what service generates it, then applies a standardized data model so that you can correlate and analyze all events. Since your IT operations and security teams share the same information, they can communicate more effectively.
Further, with Graylog’s lightning-fast search capabilities, your security and IT teams can get the answers they need, even when they’re searching terabytes of data. Purpose-built for modern log analytics, Graylog gives you the two-for-one solution necessary to improve performance and reduce cybersecurity risk. Our cloud-native capabilities and out-of-the-box security content give your teams the ability to collaborate effectively, reducing service downtime and alert fatigue.
To learn how Graylog can help you save money and respond more effectively to issues, contact us today.


