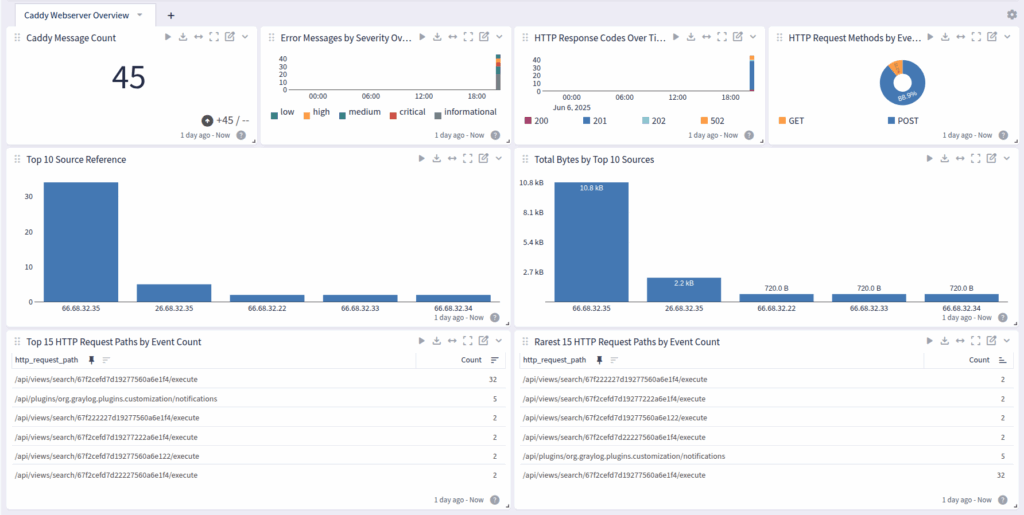
If you’re running Caddy Webserver on Ubuntu, Graylog now has a new way to make your access logs more actionable without tedious parsing or manual setup. The new Caddy Webserver Content Pack, available in Illuminate 6.4 and a Graylog Enterprise or Graylog Security license, delivers ready-to-use parsing rules, streams, and dashboards so you can quickly turn raw logs into structured, searchable insights.
What is Caddy Webserver?
Caddy is a popular web server because it’s lightweight, easy to configure, and comes with automatic HTTPS by default, thanks to its built-in Let’s Encrypt integration. It supports modern protocols like HTTP/2 and HTTP/3, offers simple yet powerful configuration through a human-friendly syntax, and runs efficiently with minimal dependencies. Developers and system administrators appreciate Caddy’s security-focused defaults, cross-platform support, and ability to serve static files, reverse proxy applications, and handle complex routing with minimal setup.
What This Pack Does
The Caddy Webserver Content Pack is purpose-built for environments running Caddy version 2.7.x on Ubuntu. Once installed, it automatically parses access logs into Graylog schema-compatible fields, tagging each event with the GIM code 180200 (http.communication) so they integrate seamlessly into your security workflows.
Included in the pack:
- Stream: Illuminate:Caddy Webserver Messages – created automatically if it doesn’t exist, with routing rules preconfigured.
- Index Set: Caddy Webserver Logs – pre-defined and ready for tuning after installation.
- Parsing Rules: Extracts structured fields such as remote IP, HTTP method, URI, status code, and more.
- Dashboard: Creates a dashboard overview with message counts, severity, response codes, request paths and others.
Requirements
To use this pack, you’ll need:
- Ubuntu/Linux with standard Caddy log paths.
- Filebeat with Graylog Sidecar for log delivery.
- Graylog Enterprise or Graylog Security with Illuminate installed.
Getting Logs into Graylog
- Configure Graylog Server
- Create a global Beats input in Graylog.
- Generate a Graylog REST API token.
- In Sidecar, create a Filebeat configuration for Linux and set:
filebeat.inputs:
  - input_type: log
    paths:
      - /var/log/caddy/*
    type: filestream
    fields_under_root: true
    fields:
      event_source_product: caddy_webserver
- Install and Configure Sidecar on the Caddy Host
wget https://packages.graylog2.org/repo/packages/graylog-sidecar-repository_1-5_all.deb

sudo dpkg -i graylog-sidecar-repository_1-5_all.deb

sudo apt-get update && sudo apt-get install graylog-sidecar

Edit /etc/graylog/sidecar/sidecar.yml with your Graylog server URL and API token, then install and start the service.
- Install Filebeat
wget -qO - https://artifacts.elastic.co/GPG-KEY-elasticsearch | sudo apt-key add -

sudo apt-get install apt-transport-https

echo "deb https://artifacts.elastic.co/packages/oss-8.x/apt stable main" | sudo tee -a /etc/apt/sources.list.d/elastic-8.x.list

sudo apt-get update && sudo apt-get install filebeat

sudo systemctl enable filebeat

sudo systemctl start filebeat
Why Log Caddy Webserver Logs?
Logging Caddy Webserver logs gives you more than just HTTP request history — it can directly support security, performance, troubleshooting, and compliance use cases. Here’s a breakdown.

Security Monitoring
- Detect Malicious Activity
- Identify brute-force login attempts, directory traversal (../) exploits, or repeated 404s from the same IP.
- Spot unusual request patterns that could indicate reconnaissance or a botnet probe.
- Track Suspicious Clients
- Find requests with unusual User-Agent strings, malformed headers, or high request rates.
- GeoIP Correlation
- See where requests are coming from and detect anomalies (e.g., sudden traffic from countries where you have no users).
Performance & Optimization
- Monitor Response Times
- Track slow requests by path, method, or upstream target.
- Correlate spikes in latency with backend or network issues.
- Traffic Analysis
- Understand peak usage hours, top requested endpoints, and request method distribution.
- Bottleneck Identification
- Pinpoint routes causing high CPU/memory usage due to expensive processing.
Troubleshooting & Incident Response
- Error Investigation
- Analyze 4xx and 5xx patterns to quickly identify misconfigurations or service failures.
- Debugging
- Review request/response logs when APIs or web apps behave unexpectedly.
- Historical Context
- See what happened leading up to an outage or anomaly.
Compliance & Audit
- Regulatory Requirements
- PCI DSS, HIPAA, SOC 2, and similar frameworks often require logging of all access to sensitive systems.
- Forensic Evidence
- Maintain an immutable record for post-incident analysis or investigation.
- Retention Policies
- Store logs in a central system to meet audit trail requirements.
Integration & Automation
- Centralized Observability
- Send Caddy logs to Graylog to correlate with application, system, and security logs.
- Alerting
- Trigger alerts for abnormal traffic patterns, high error rates, or possible DDoS events.
- Automated Blocking
- Integrate log-based rules with WAFs or firewalls to block malicious IPs in real time.
Graylog Enterprise and Security
By operationalizing your Caddy logs in Graylog, you can quickly detect anomalies, identify suspicious requests, and feed relevant data directly into your threat detection and response workflows. For more info on what fields are available click here


