We would like to introduce an additional method of security monitoring: capturing all DNS requests that are made within your network. This post will be the first of a two part series that covers the collection and analyzation of DNS requests. Our second post will focus on automatically flagging bad actors by integrating threat intelligence databases with Graylog.
Let’s dive in!
Why monitor DNS requests?
If a computer is infected, in most cases, the malware or attacker will do one of three things: try to load more code, open a backchannel to exfiltrate data, or wait for further instructions. Typically, the attacker will be using a domain name instead of a hard-coded IP because it offers more flexibility. To our advantage, this will result in a DNS lookup that can be easily spotted.
Another benefit of using this technique is that we can spot attacks instantaneously. For example, a user that clicks on a phishing link will be caught the moment the browser performs the DNS lookup to open the “fake” website. The same happens when infected machines try to call their command and control hosts.
How to capture the data?
The classic approach to collect all DNS requests is to write all requests the DNS servers receive to a log file and then to transfer those logs into Graylog. However, there are at least 3 issues with this approach:
A new approach is to simply listen for all DNS requests that go through your cables. By listening to the wire data that goes to your DNS servers and that leaves your networks to the internet, you will be able to spot every DNS request. A span port or network tap will allow you to detect all DNS requests, regardless of final location or logged format.
An architecture using this approach is demonstrated below:
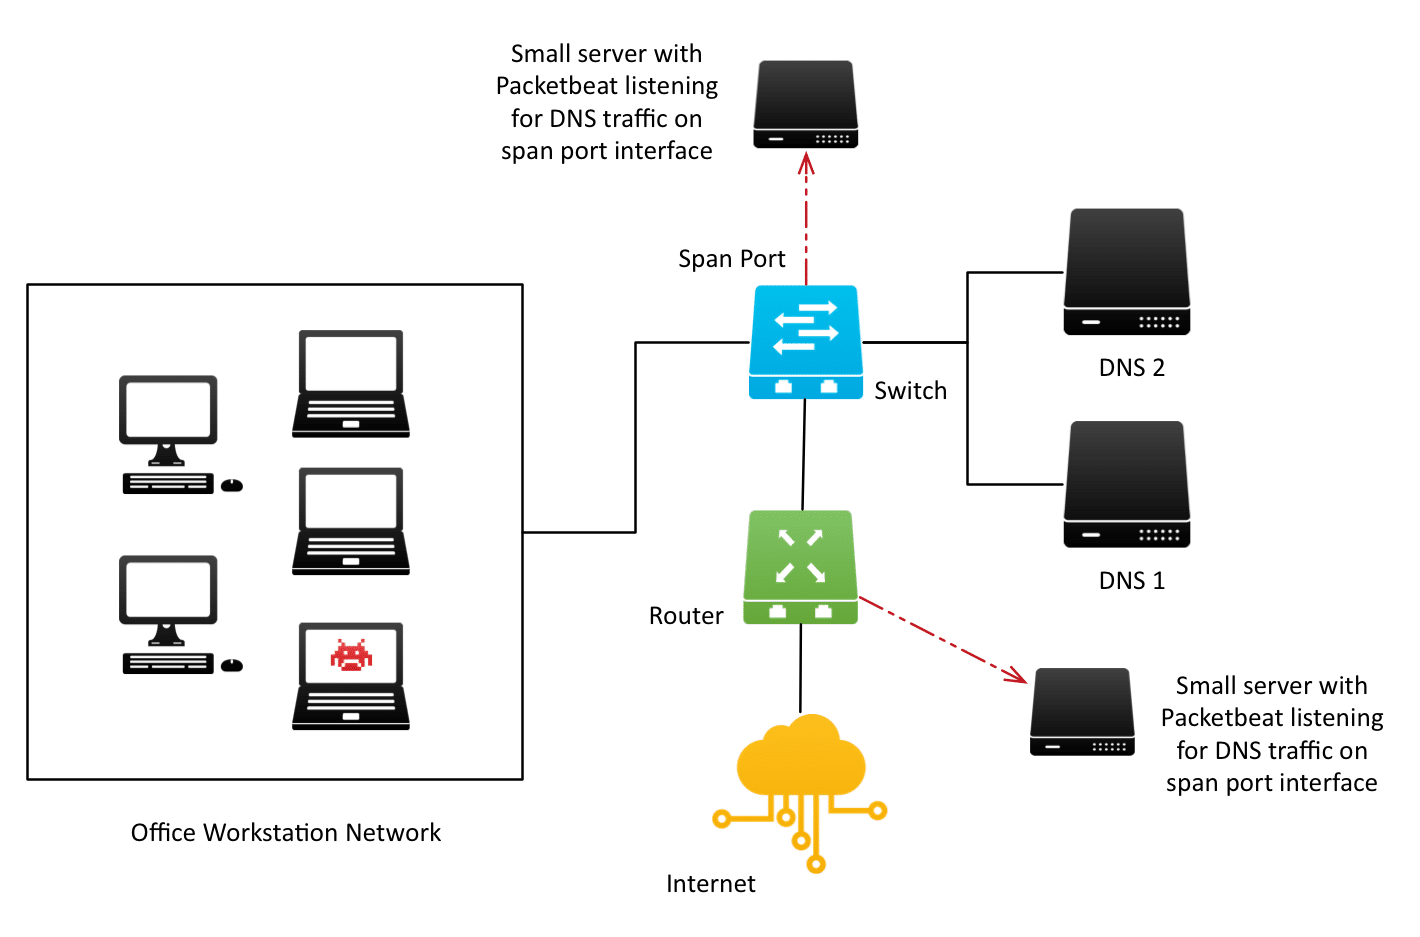
We’ll be using Packetbeat to listen to all wire traffic with destination_port:53 and the default DNS packet decoder to parse important information out of the raw traffic.
Configuring Packetbeat
This tiny Packetbeat configuration file is all you need:
interfaces:
device: any
protocols:
dns:
ports: [53]
include authorities: true
include additionals: true
output:
logstash:
hosts: [“graylog.example.org:15999”]
It instructs Packetbeat to …
Lastly, we need to instruct Graylog to receive and parse the messages from Packetbeat.
Configuring Graylog
First, install the Graylog Beats input plugin and start a Beats Input on the port you configured in your Packetbeat configuration.
You should see messages coming in immediately after starting the input if Packetbeat is already configured and running.
You will notice that the messages have several standard fields, most of which we will not need.
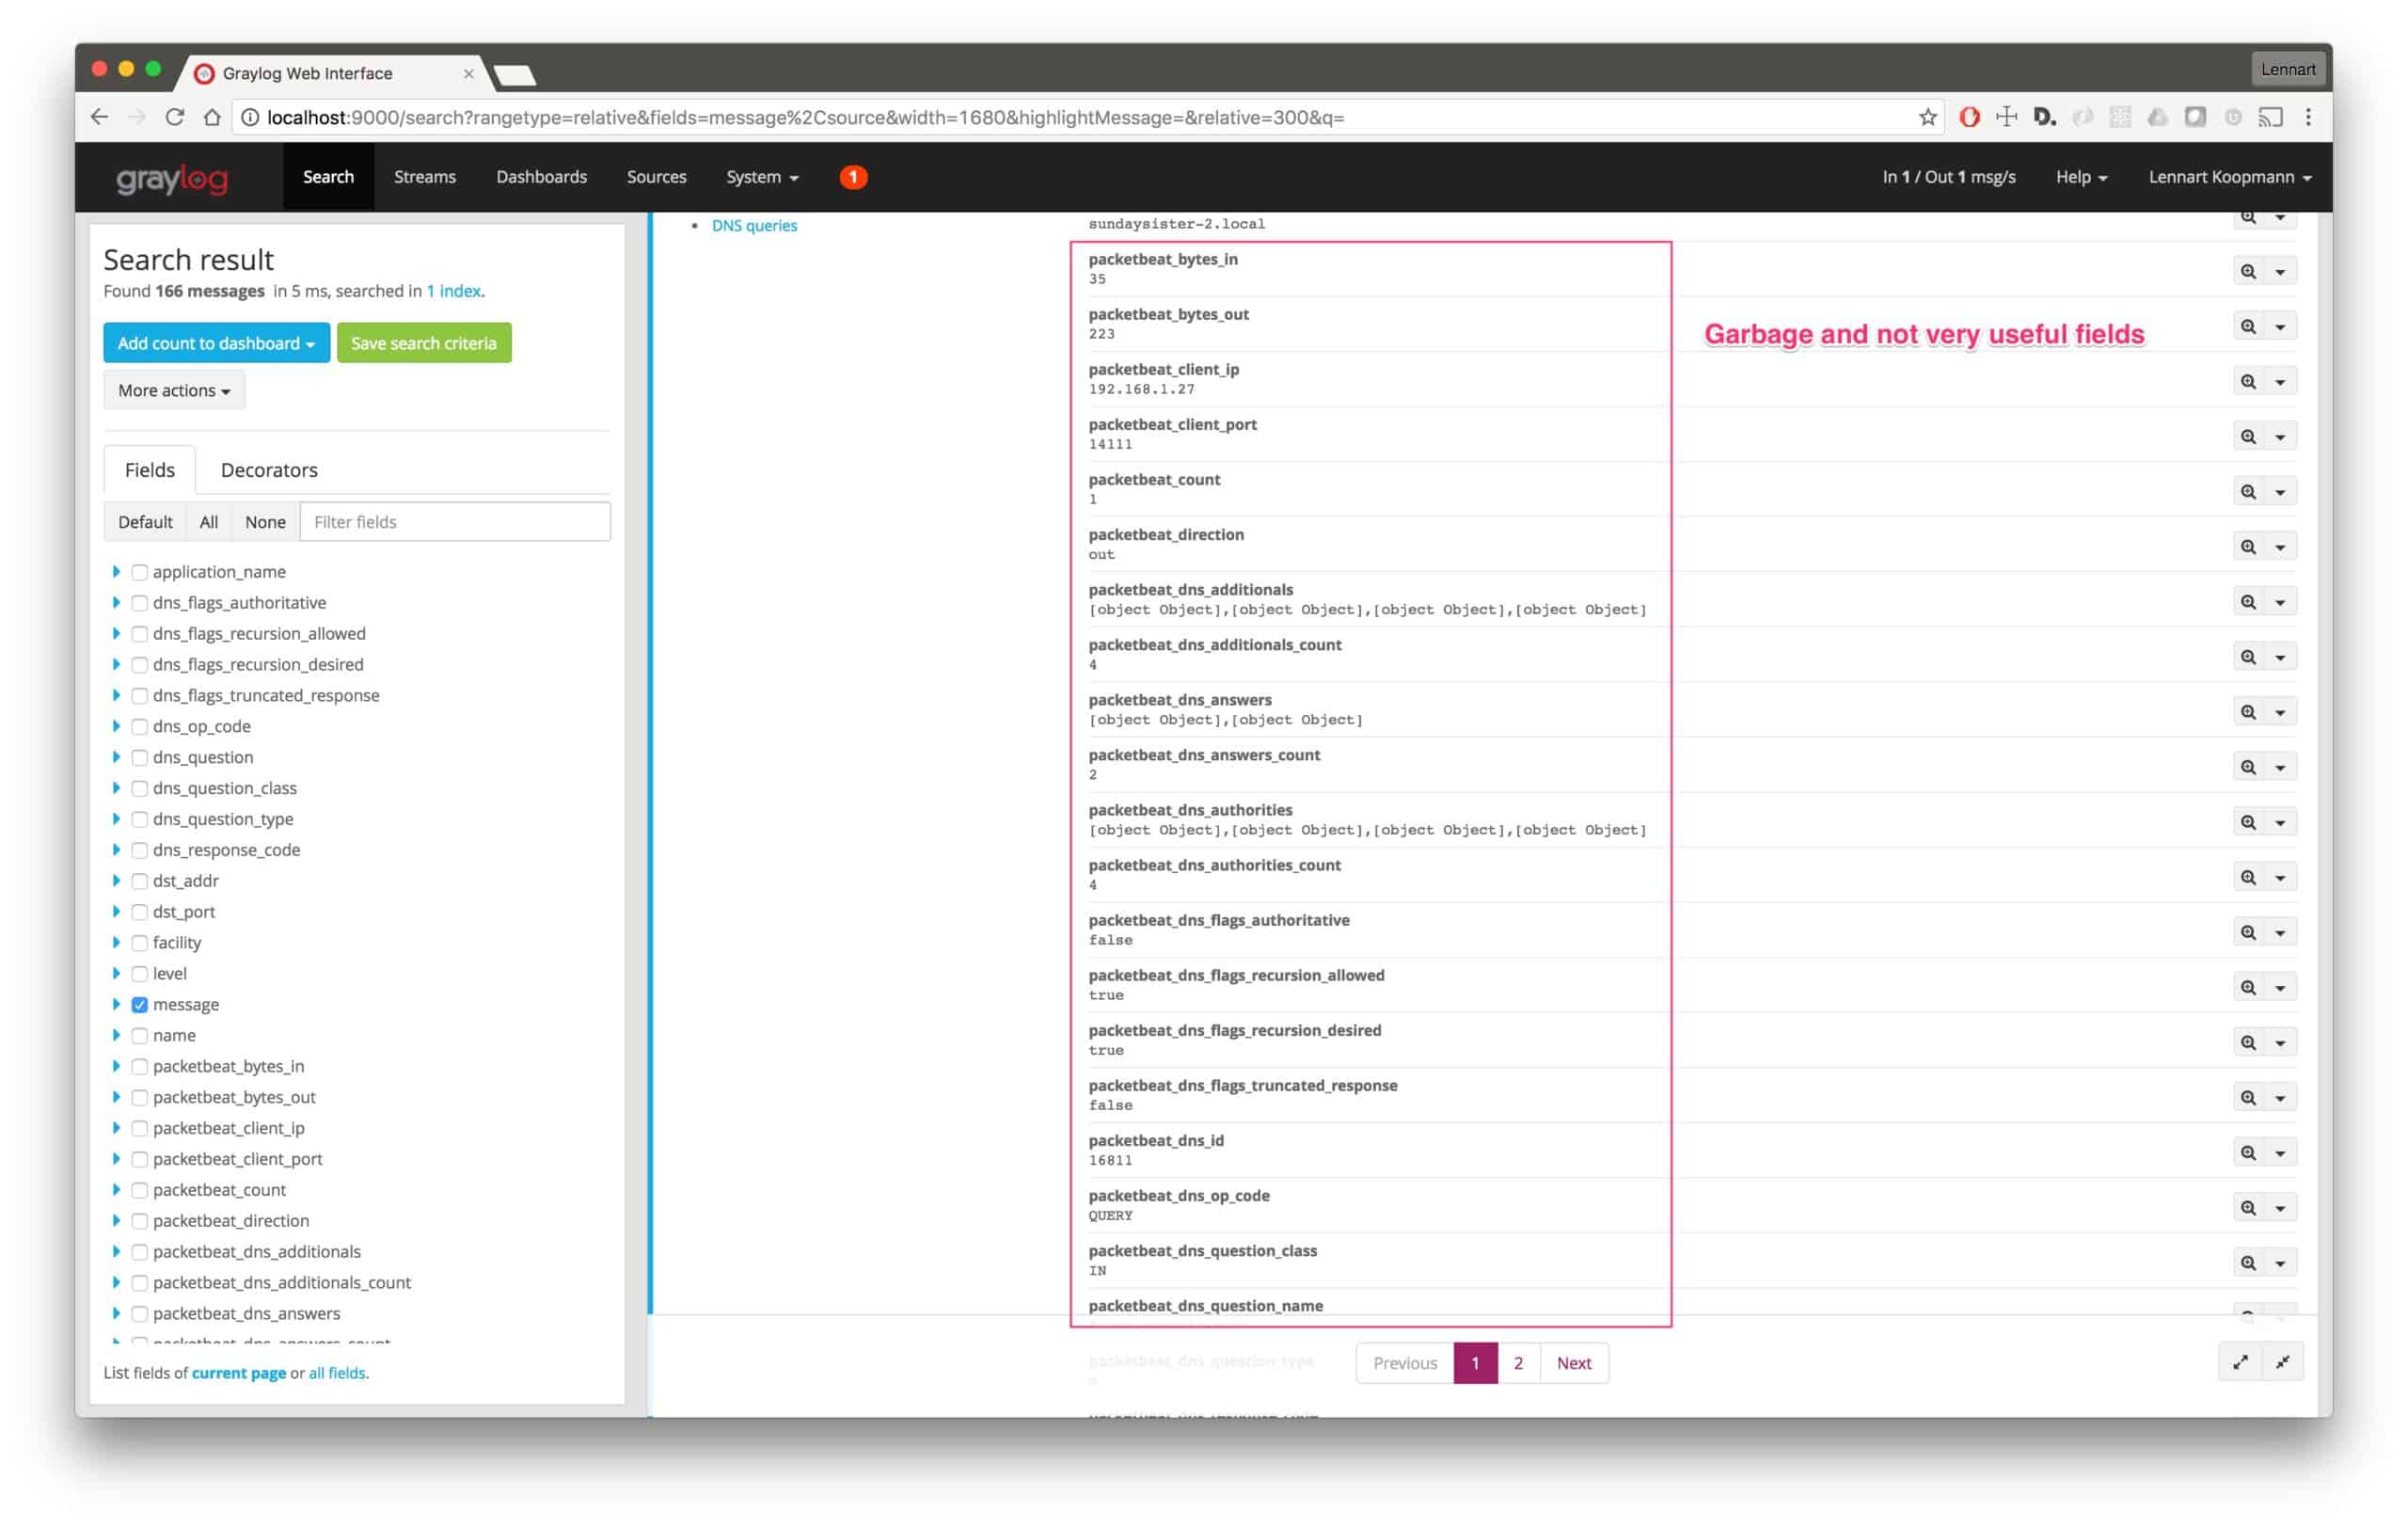
Let’s build a Processing Pipeline rule to remove all the unneeded clutter and to format the messages nicer:
rule “rewrite raw packetbeat DNS logs”
when
has
name);remove
ip);
remove
setfield(“dstaddr”, $message.packetbeatip);
remove
field(“packetbeat_ip”);
setfield(“dnsflagsauthoritative”, tobool($message.packetbeatdnsflagsauthoritative));
remove
field(“packetbeatdnsflags_authoritative”);
setfield(“dnsflagsrecursionallowed”, tobool($message.packetbeatdnsflagsrecursionallowed));
remove
field(“packetbeatdnsflagsrecursionallowed”);
setfield(“dnsflagsrecursiondesired”, tobool($message.packetbeatdnsflagsrecursiondesired));
remove
field(“packetbeatdnsflagsrecursiondesired”);
setfield(“dnsflagstruncatedresponse”, tobool($message.packetbeatdnsflagstruncatedresponse));
remove
field(“packetbeatdnsflagstruncatedresponse”);
code);
remove
class);
remove
type);
remove
code);
remove
port));
remove
setfield(“srcport”, tolong($message.packetbeatclientport));
remove
field(“packetbeatclientport”);// Remove fields we don’t need or want.
remove
in”);
remove
authorities”);
remove
count”);
remove
answers”);
remove
direction”);
remove
responsetime”);
remove
error”);
remove
transport”);
remove
method”);
remove
resource”);
remove
status”);
remove
type”);
remove
query”);
remove
disabled”);
remove
additionals”);
remove_field(“facility”);// Remove trailing . if there is one
let fix = regex(“(.+?).?$”, to
question));
set
string($message.dns_question)));end
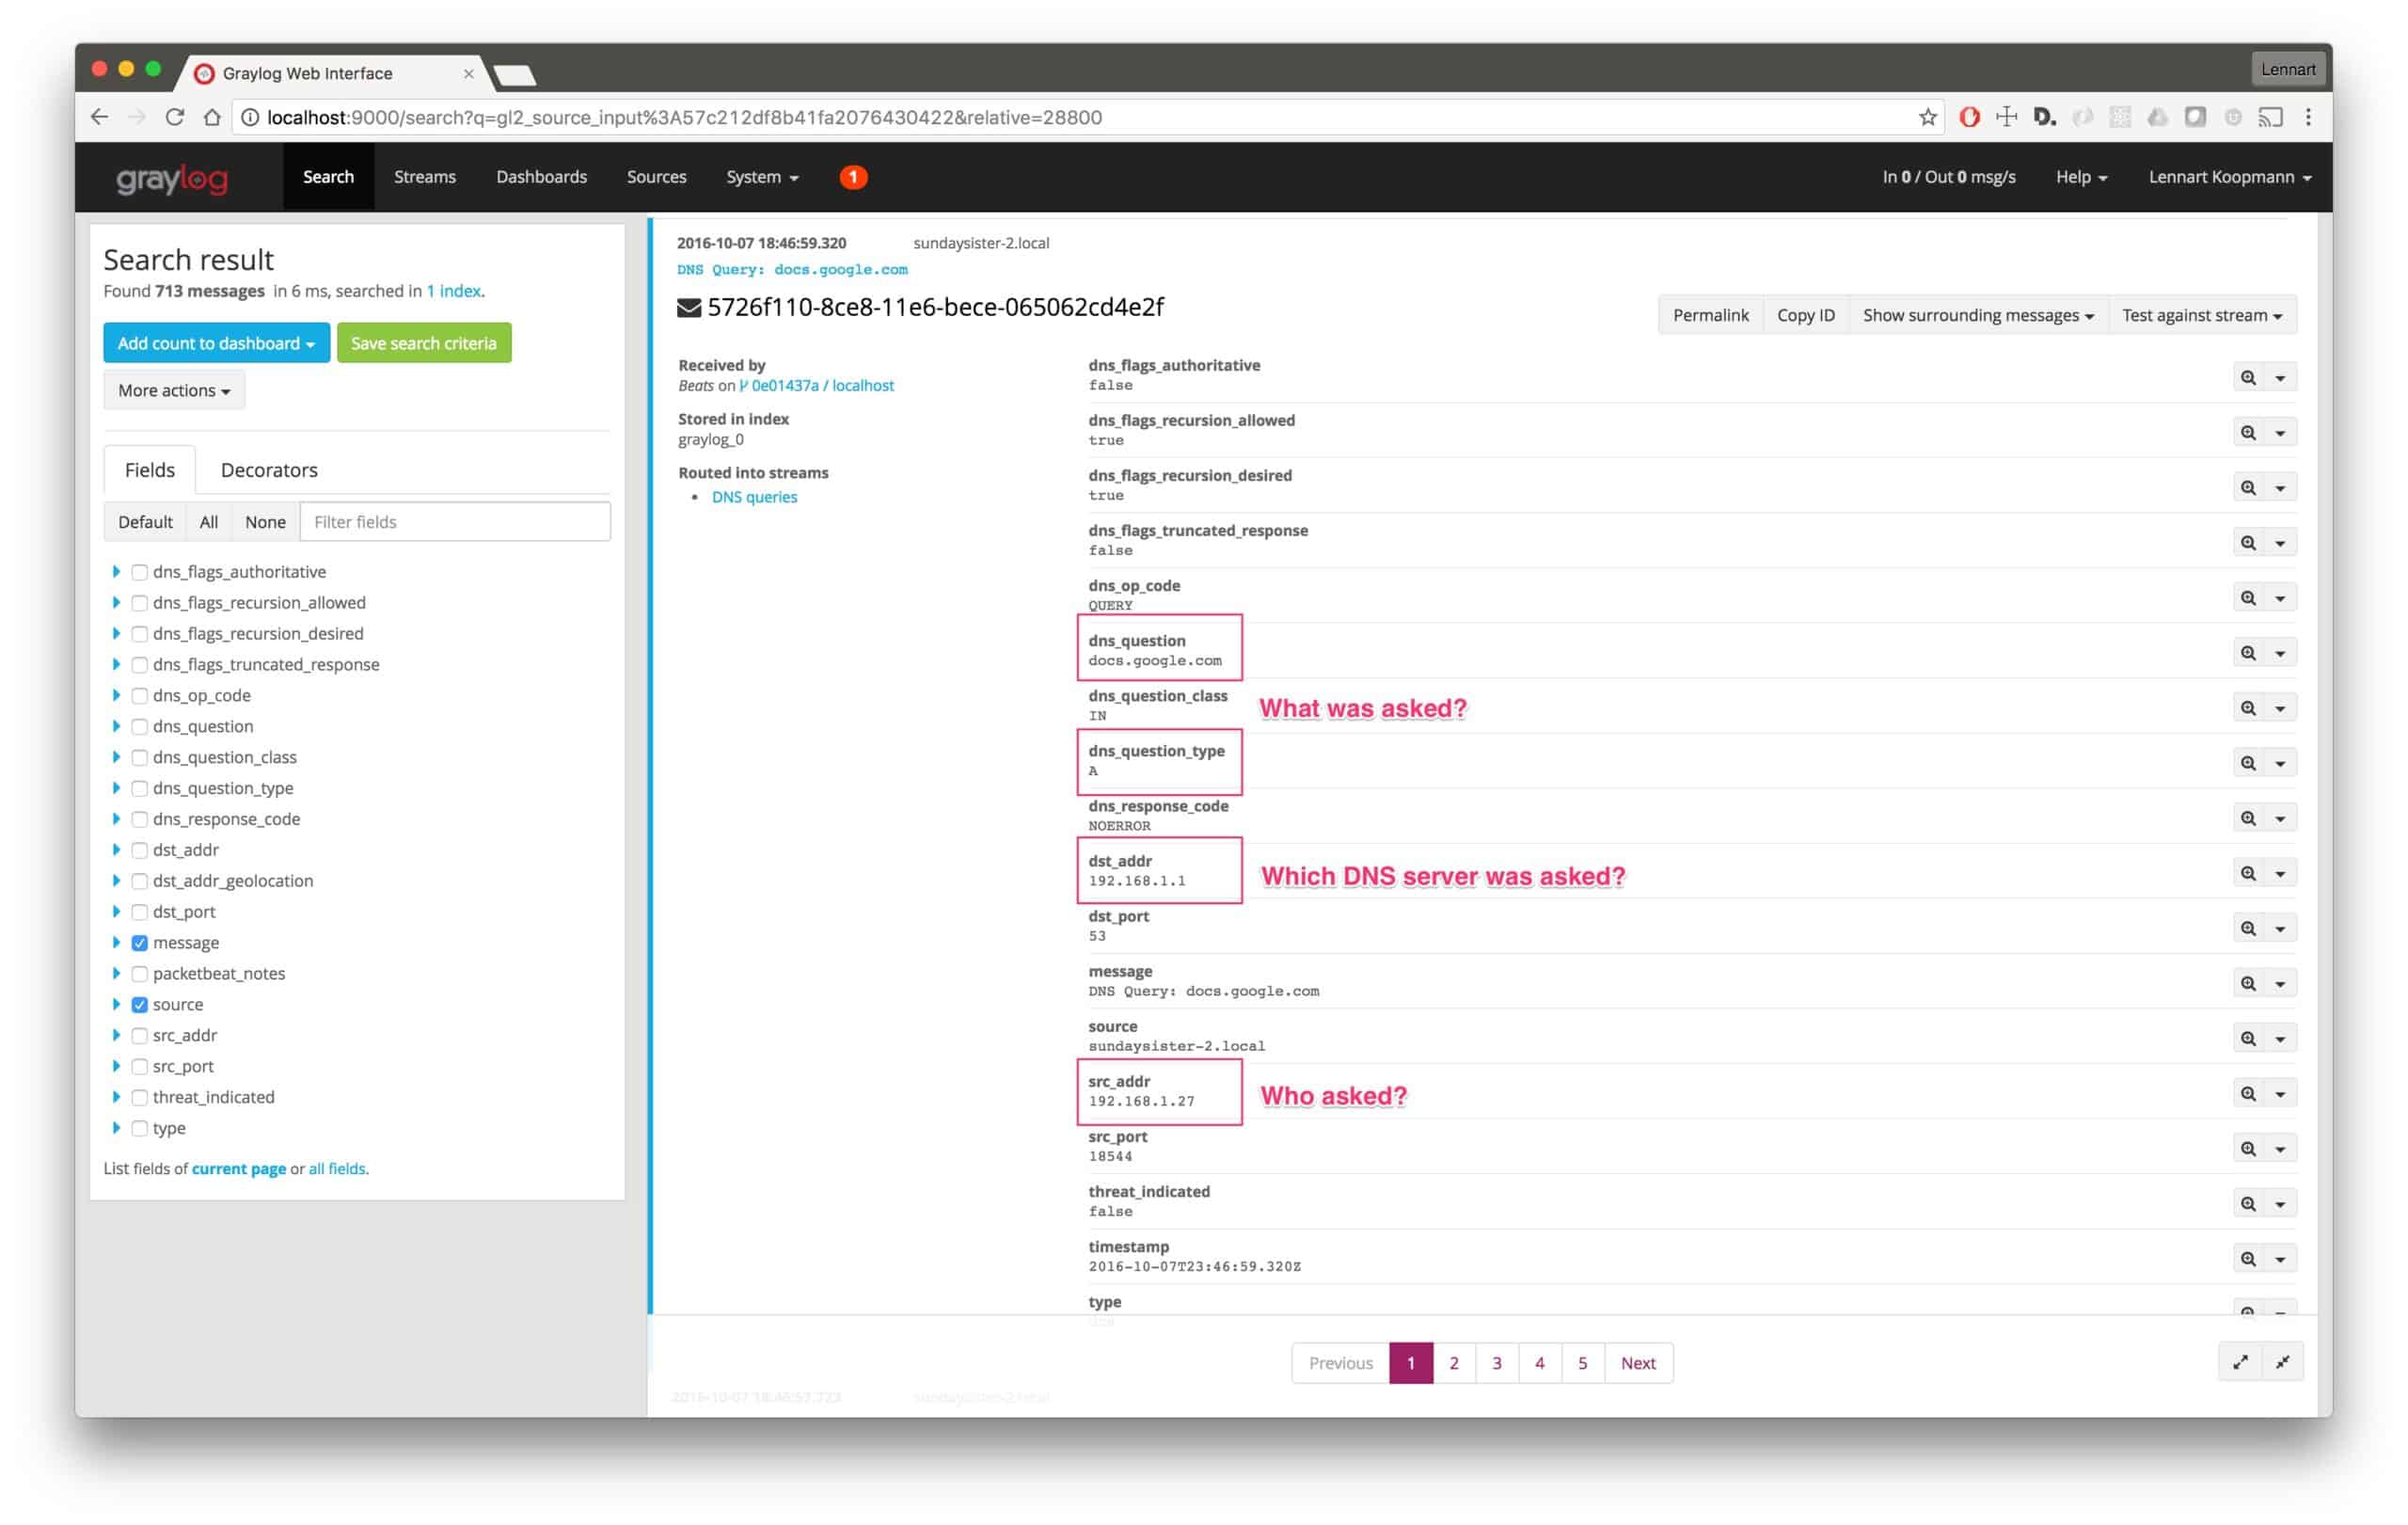
Now that you have every DNS request coming into Graylog, let’s look at real-world analysis use-cases.
Analyzing the captured data
Let’s assume you want to see which DNS servers are being used in your network. Most likely, you will want to make sure that only your internal servers are being used.
Start by searching for all DNS requests:
type:dns
Now run a quick values analysis on the dst_addr field to find all destination addresses of DNS requests (remember, we searched for type:dns)
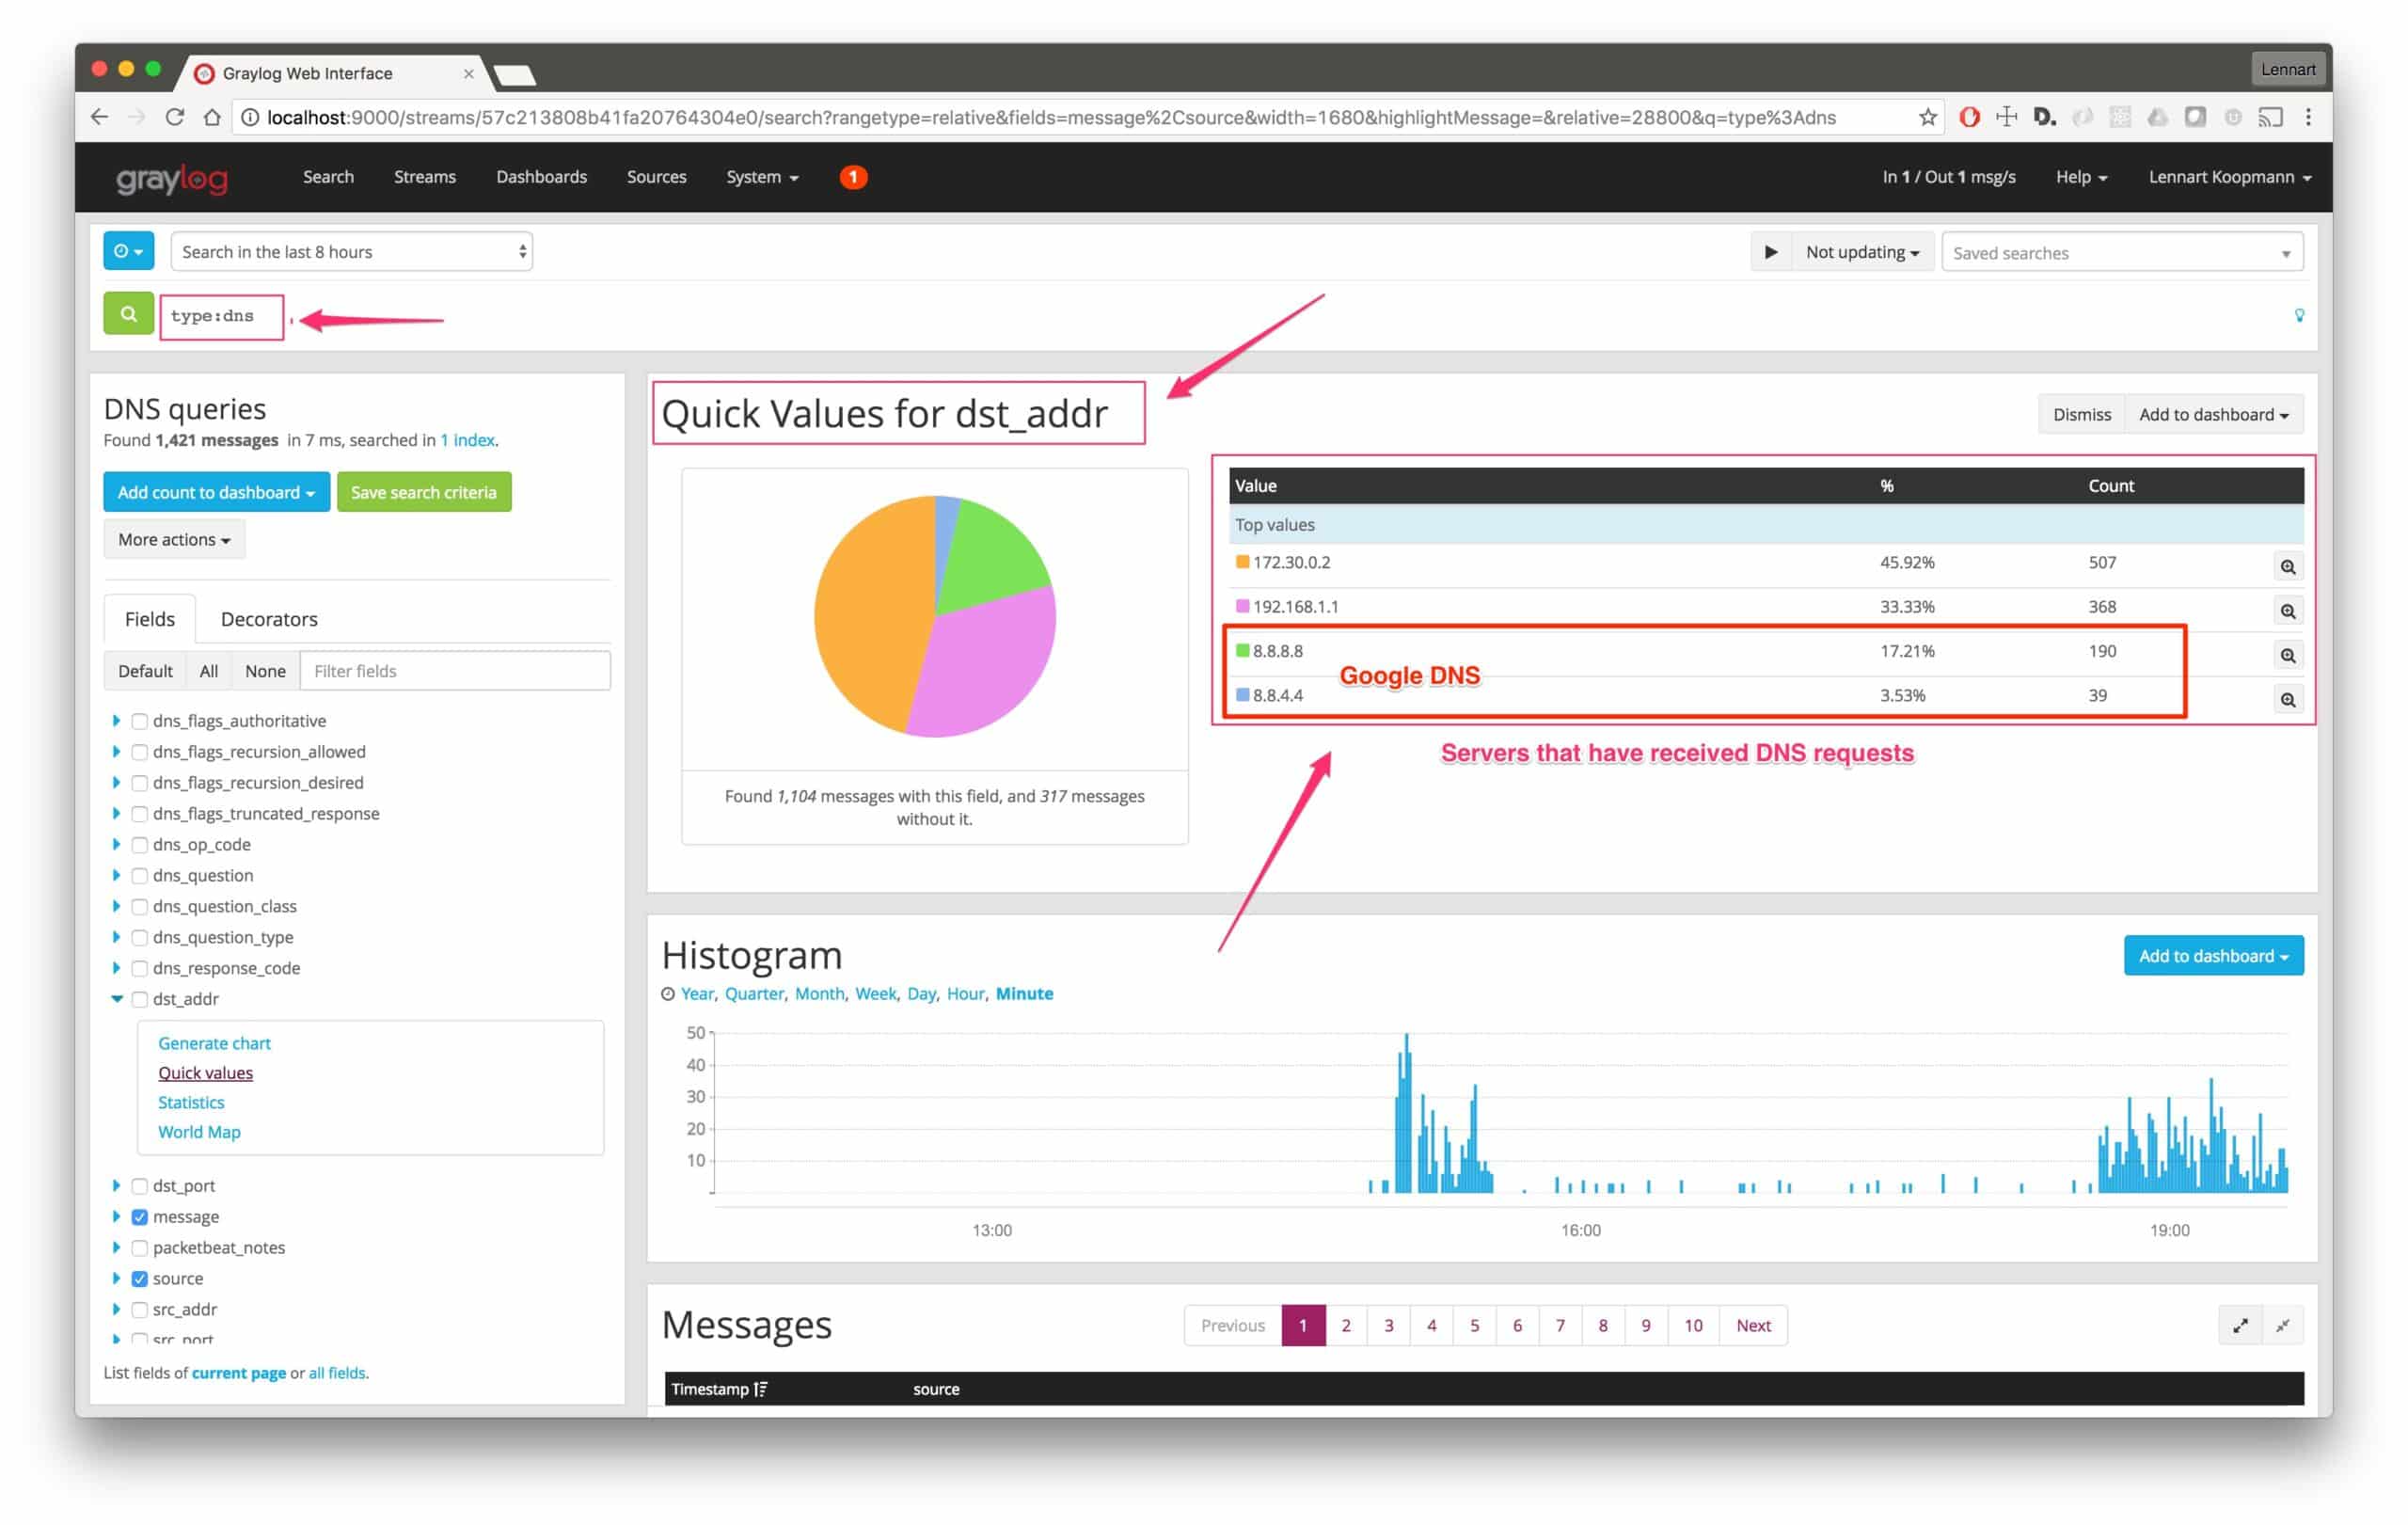
As you can see, there have been 229 requests made to DNS servers not under our control. In this case, it is the public Google DNS servers, but we should still investigate and make sure that the machines that use those servers are re-configured.
To find out what machines were making those requests, we will need to run a new query:
type:dns AND (dst_addr:8.8.8.8 OR dst_addr:8.8.4.4)
Now run a quick values analysis on the src_addr field:
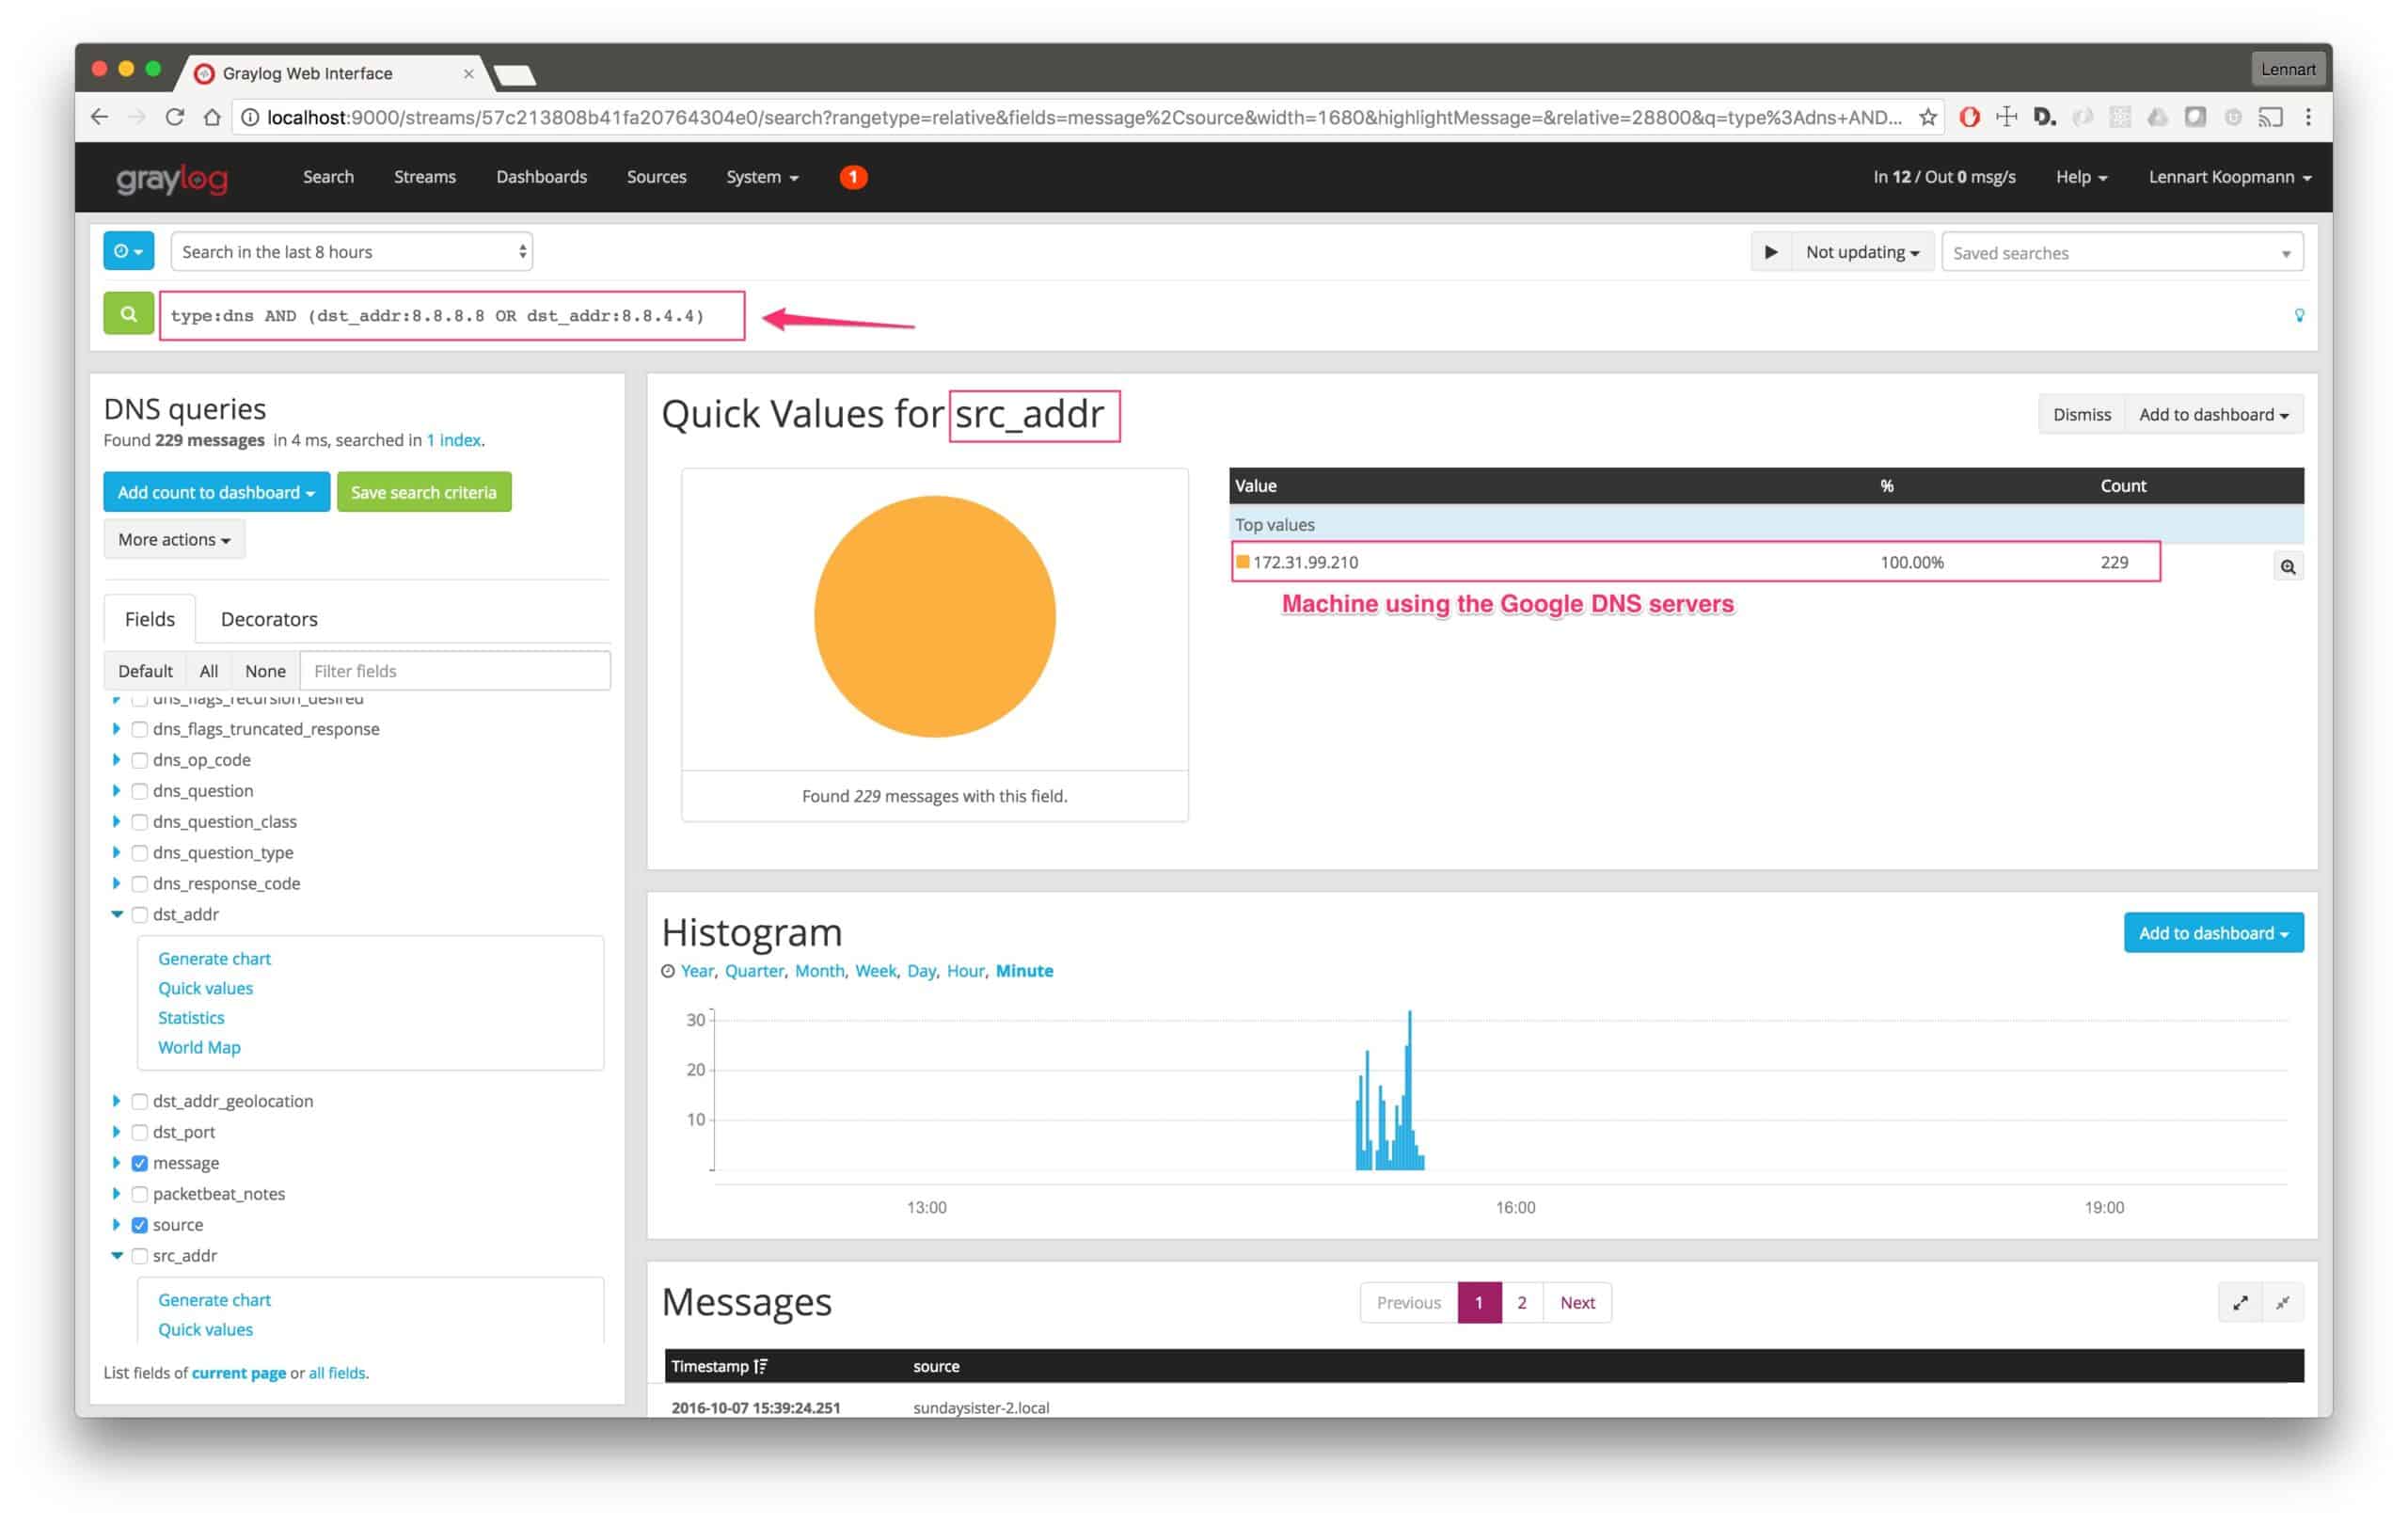
This is how fast you can get the result. The machine with the IP address 172.31.99.210 is using Google DNS servers instead of your own DNS servers for some requests.
Next steps could be:
This is only one example. Another useful thing is to just scroll through the actual hostnames that were resolved via DNS to see if there is anything suspicious going on. See the last paragraph of this post about automatic enrichment with threat intelligence data to automatically detect machines communicating with malware command and control systems.
Legal aspects
Note that you should first consult with HR or an attorney to make sure that you are not invading privacy by collecting DNS requests and that employment agreements allow this practice.
Next steps / Enriching the data
Due to its size, you can see that it will become difficult and time-consuming to manually sift through DNS data. To improve efficiency, you will want to implement an automatic enrichment that can mark requested domains as an indicator of compromise. Consider this, a Windows workstation is sending a DNS request for a known malware command & control host. If that request was automatically marked with threat_indicated:true, you could quickly filter through and be alerted of this incident.
So how do we automate this process?…
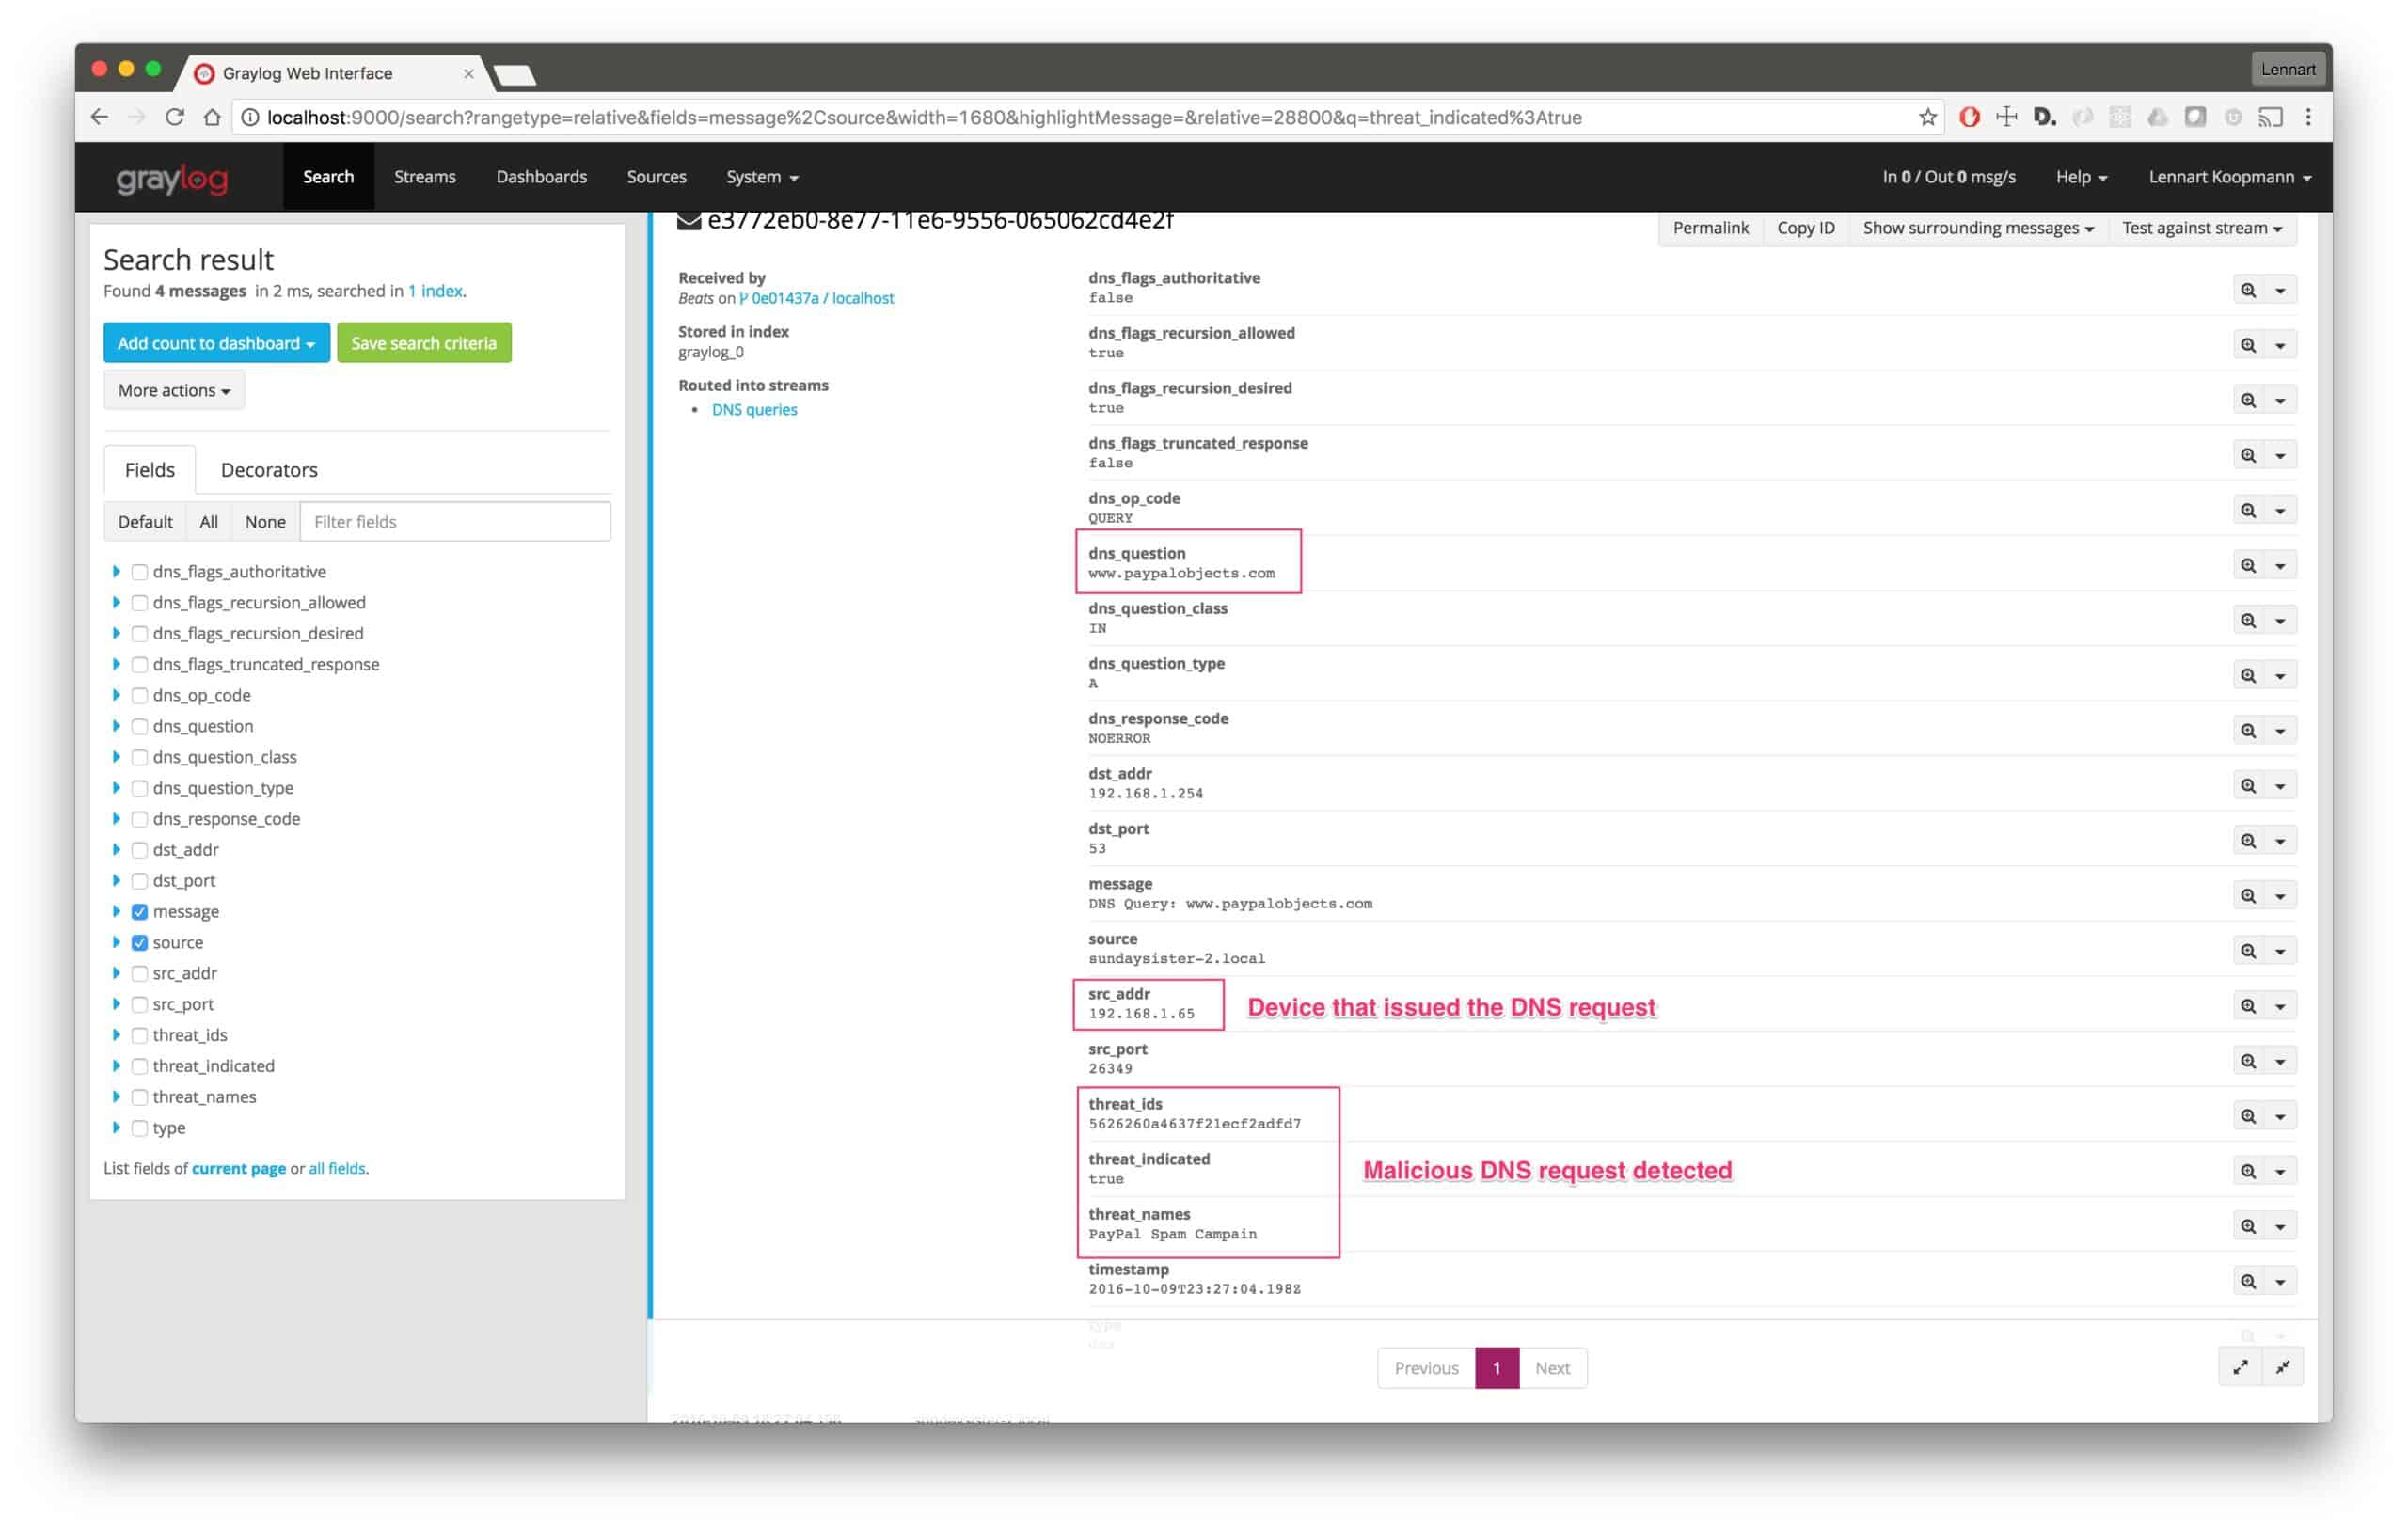
Our next blog post will look at integrating threat databases with Graylog to automatically flag DNS requests of domains that are known bad actors.
Subscribe to our newsletter or follow us on Twitter to be notified when it is released!As we continue our discussion on security monitoring, we find there are multiple ways to defend attackers on the outside network perimeters and to detect intruders that have landed inside your network. The combined force of virus scanners, firewalls, IDS systems, and a log management system is a great way to protect your network.

