Whether you’re an Apple fan or not, one of the reasons people buy into their ecosystem is ease of setup across different devices. In a world where people customize the applications on their laptops to cross over with their mobile phones, an easy setup is a key to getting the most value from their devices. However, in the world of security information and event management (SIEM) solutions, the time to value often takes longer than most security teams want to admit.
Getting the most out of your SIEM starts with laying the right groundwork. From day one, your goal should be clear: actionable visibility that empowers your teams to detect threats, investigate incidents, and meet compliance requirements without unnecessary complexity or noise.
A well-structured initial setup not only helps you catch what matters most, but it also sets the stage for faster insights, reduced alert fatigue, and smoother handoffs between security, IT, and compliance. From data ingestion to scheduling reports, these seven practical SIEM configurations improve time to value so you can get the most security bang for your budget buck.
1. Identify Basic Use Cases
The use cases that you choose will act as the foundation for your log sources. While you can expand your use cases over time, some basic ones that will help you get the most out of your initial deployment typically include:
- User activity: activities like authentications, account creations, logon attempts by user name, logon failures, and logon successes
- Host activity: activities related to specific hosts and devices
- Network activity: network traffic data, including usage by source, destination, username, and IP address
2. Select Initial Log Sources
Your initial log sources should provide the information needed to configure the alerts that map to your use cases. When you map your data sources to your use cases, you should consider whether the data is used to:
- Build alerts or correlations
- Write compliance reports
- Provide forensic data after an incident or for an incident report
Some typical sources include:
- Authentication data, typically from Active Directory or another primary source of user identify
- Endpoint monitoring data, including domain controllers, critical servers, and endpoint detection and response (EDR) tools
- Network devices, like firewalls, virtual private networks (VPNs), and routers
- Externally facing services, like web servers, reverse proxies, and web application firewalls (WAFs)
- Cloud applications, like SharePoint, Google Suite, SAP, and Amazon Web Services (AWS)
3. Configure Data Pipelines
Data pipelines perform transformations on the log messages so that you can parse and normalize them. This process is what allows you to compare data from different technologies across the environment to gain insights. Typically, these pipelines apply logic to the data to identify the different log fields you want to use when correlating and analyzing events.
As you configure the pipelines, you should consider the following types of inputs:
- Listener: The source pushes data to your SIEM.
- Pull: The SIEM reaches out and pulls data into it, often using an API.
For example, hosts that use Syslog are often listener inputs. Meanwhile, a lot of cloud applications are pull inputs. Some examples of these include:
- AWS CloudTrail
- AWS Cloudwatch
- CrowdStrike
- Okta Log Event
- Microsoft 365
4. Route Data to Chosen Storage
Data routing allows you to send your log data to different storage locations based on how frequently you need to access it. Typically, this configuration begins by asking:
- Why do I need this data?
- What destination serves that purpose best?
- What specific data should go to that location?
- How do you need to filter data for your intended destination?
As part of your data routing configuration, you may want to consider different data tiers to help reduce overall storage costs. Data tiering allows you to group data based on how often you use it and the search performance you need. At a basic level, you should consider these three data tiers:
- Hot tier: data necessary for real-time alerts and investigations
- Warm tier: data not immediately necessary that may require searching in some cases
- Data Lake: less critical data, often retained for compliance purposes but recalled when needed.
5. Set User Permissions
Having a SIEM allows the security and IT teams to collaborate more effectively, but as with any resource, not all people need the same level of access. When implementing your initial user permissions, you want to ensure that you apply the principle of least privilege so that people have only the access they need to the solution, especially since log data can contain sensitive information like user credentials.
Some different roles to consider include:
- Read/View: read-only permissions, which can be valuable for compliance teams who need visibility but not control
- Read/write: permissions that allow the user to make changes to a dashboard, like security analysts or IT help desk staff
- Creator/Administrator: permissions that allow the user to create new streams, dashboard, searches, event definitions, or alerts
6. Build Detections and Alerts
After defining the data you need and the people who will use the SIEM, you can finally start building detections and alerts. Detections are the activities that happen within your systems and networks that you need to know about. Alerts can define how you receive messages about these events.
Your detections map to the use cases you defined before deploying your SIEM and use the log data that you chose to ingest. When designing your detections, some considerations should include:
- Event type: Defining events takes into consideration the types of searches that you might need to identify a security incident, like a list of IP addresses or failed logins. When you write a detection around multiple searches, you can build complex correlations for more nuanced event alerts.
- Priority level: For each defined event type, you should consider how your security team needs to prioritize responses. Even a simple low, medium, and high prioritization can help reduce alert fatigue.
- Alerts: When you build your events and detections, you can set how your team receives alerts. For example, you may want to have people receive emails or get notified in a communications application, like Microsoft Team or Slack.
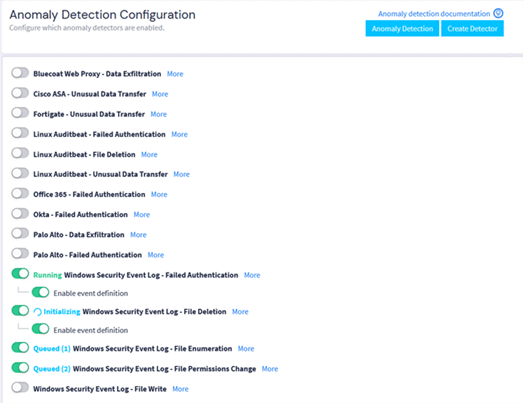
For example, your solution might come with built-in anomaly detection that applies artificial intelligence (AI) and machine learning (ML) to large data sets.

Anomaly detection capabilities will pull data from your log messages, compare the activity to your normal system data, then identify outliers that can indicate a potential security incident. This streamlines your initial deployment by providing some out-of-the-box configurations so you can get more value from your SIEM, faster.
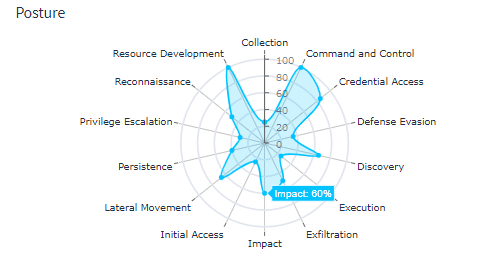
Another example of events that can turn into alerts are Sigma rules. Sigma rules are vendor-agnostic detections that help you identify suspicious events in your environment. They match log events to adversarial behavior or cyber threats. When you enrich these detections by mapping them to adversary tactics and techniques, like the MITRE ATT&CK Matrix, you can improve your security posture by determining your threat coverage. By configuring the Sigma rules that cover different adversary tactics and techniques, you can improve your overall threat coverage for enhanced security detection and alerting.

7. Build Dashboards and Compliance Reports
Dashboards are visualizations that display real-time or historical data based on your log sources, allowing you to monitor, analyze, and visualize key metrics in one location. These charts and graphs should map to the use cases that you defined in the beginning so you have at-a-glance visibility into your system security. For example, these two dashboards would help you identify potential security incidents:
- System health and performance: Performance metrics not only provide insight into your systems’ health but deviations from the norm can be used to trace the root cause of a security incident. For example, high CPU or memory usage may indicate malware installed on an endpoint.
- User behavior tracking: By monitoring access logs and user activity patterns, you can find abnormal behaviors that might indicate a potential insider threat, like attackers using stolen credentials.
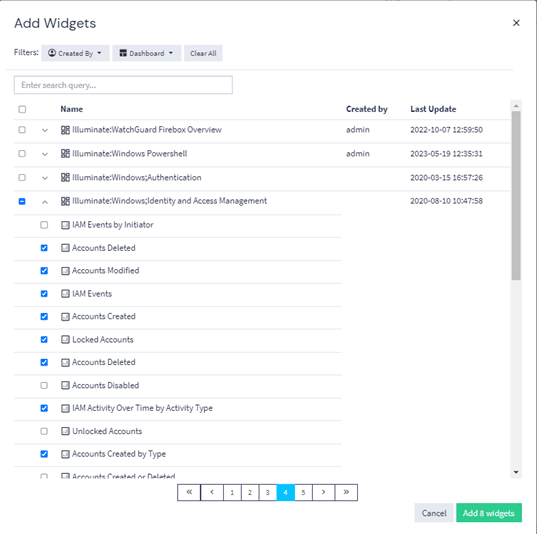
Often, your dashboards can become compliance reports when you map them to the controls that you monitor. For example, an identity and access management (IAM) report for your compliance team may include the accounts deleted and modified so that you can compare these to your human resources records for employees whose jobs within the company changed or who are no longer employed with you. By scheduling these in advance, you can streamline the access review process without adding to your own to do list.

Graylog Security: Your low total cost of ownership SIEM
Using Graylog Security, you can rapidly mature your threat detection and incident response capabilities. Graylog Security’s Illuminate bundles include rulesets with content that includes Sigma detections, enabling you to uplevel your monitoring by incorporating threat hunting capabilities and correlations to ATT&CK TTPs.
By leveraging our cloud-native capabilities and out-of-the-box content, you gain immediate value from your logs. Our anomaly detection ML improves over time without manual tuning, adapting rapidly to new data sets, organizational priorities, and custom use cases so that you can automate key user and entity access monitoring.
With our intuitive user interface, you can rapidly investigate alerts. Our lightning-fast search capabilities enable you to search terabytes of data in milliseconds, reducing dwell times and shrinking investigations by hours, days, and weeks.
To learn how Graylog Security can help you implement robust threat detection and response, contact us today.


