Database application performance troubleshooting can be time consuming and frustrating. The good news is that many of these issues can be identified and resolved using the information stored in log data.
In this blog post, I’m going to show you how Graylog can help you troubleshoot slow MongoDB queries in just a few minutes, using Graylog’s plug-in for MongoDB. Database profiler tools are great at giving you query performance information, but if your application is executing hundreds or even thousands of queries a second, figuring out why your application is running slow is often like trying to find the proverbial needle in a haystack. How do you quickly find which of the thousands of queries are causing performance issues?
Read on to learn more about the MongoDB database profiler, and how Graylog can help you cut through the noise, enabling you to quickly zero in on slow-running queries so application performance can be improved before users are impacted.
What is a database profiler?
The purpose of a database profiler is to measure performance and provide diagnostic information on queries executed on a given database. The profiler gives database administrators and software developers visibility into how their database is performing and if there is an opportunity to improve query performance. For example, imagine you are querying the database for all users living in New York City. The database would execute the query and return a list of users who live there. While the query is being executed, the profiler would store information about how the query was executed internally, how long it took, how many documents were scanned, how many documents were returned, etc.
A common profiler use case is to identify which tables might benefit from adding an index, with the goal of avoiding a table scan.
MongoDB database profiler
Like most database profilers, the MongoDB profiler can be configured to only write profile information about queries that took longer than a given threshold. This way you avoid the (small) overhead for writing the profile information for every query. You can also start or stop the profiling during runtime so there is no restart of the database server required. Enabling the profiler for only a few minutes to sample some data for analysis later is a common practice. This reduces the potential negative impact of profiler overhead and the volume of data, one has to parse through.
The MongoDB database profiler writes every operation profiled as a document into the .system.profile collection, where you can query it like any other document in MongoDB.
Here is an example document of a profiled update operation:
{
“ts” : ISODate(“2014-12-10T19:31:28.977Z”),
“op” : “update”,
“ns” : “social.users”,
“query” : {
“name” : “j.r.”
},
“updateobj” : {
“$set” : {
“likes” : [
“basketball”,
“trekking”
]
}
},
“nscanned” : 8,
“scanAndOrder” : true,
“moved” : true,
“nmoved” : 1,
“nupdated” : 1,
“keyUpdates” : 0,
“numYield” : 0,
“lockStats” : {
“timeLockedMicros” : {
“r” : NumberLong(0),
“w” : NumberLong(258)
},
“timeAcquiringMicros” : {
“r” : NumberLong(0),
“w” : NumberLong(7)
}
},
“millis” : 0,
“client” : “127.0.0.1”,
“user” : “”
}
Graylog plug-in for MongoDB
In addition to the standard reading of syslog or GELF messages, Graylog comes with a stable plug-in API that supports the integration of external log sources. You can read more about plug-ins in documentation. The Graylog plug-in for the MongoDB database profiler is an example of how you can use plug-ins to extend Graylog.
Setup
To get started, simply add the plug-in .jar file to the Graylog plug-ins folder. The following examples describe what you can do with it once it is running. The setup in this example took roughly 5 minutes.
Graylog will store every profiler document like any other log message, in a structured format. The most important fields are:
- client: Hostname or IP address of operation/query origin
- collection: The collection in which the operation took place
- database: The database in which the operation took place
- docs_returned: The number of documents that were returned by this operation.
- docs_scanned: The number of documents that were scanned to complete this operation. If this is much higher than docs_returned you might be missing an index.
- docstoreturn: The number of documents the operation specified to return. Usually controlled by limit parameter of a query.
- locked_, lockwait_**: Several lock and lock acquisition timing statistics
- millis: Time from starting the operation to finishing the operation from the perspective of mongod.
- operation: The type of operation. Possible values are insert, query, update, remove, getmore, command
- query: The actual query that was executed in it’s original JSON notation
- queryfieldshash, queryfullhash: See “Fingerprinting” below
- response_bytes: Length in bytes of the returned document
- user: Username if the query was submitted by an authenticated user
- yields: Number of times the operation yielded to allow other operations to complete. Long running operations can yield their lock so other operations can complete in the meantime.
Analyze your queries
Now that you have the queries in Graylog, you can start profiling your MongoDB application.
I’m going to walk you through several common use cases that demonstrate how to navigate through the UI and gain useful insights. In this example, we’re using example data comes from a MongoDB replica set connected to a Graylog setup. Graylog uses MongoDB as our configuration store. In this example, we’re searching for slow queries that Graylog is executing itself – self-monitoring of Graylog. In your case, instead of Graylog, you would see the queries of your application that is being monitored.
Let’s start by running a Graylog query that shows you all recorded MongoDB queries in a specific time frame:
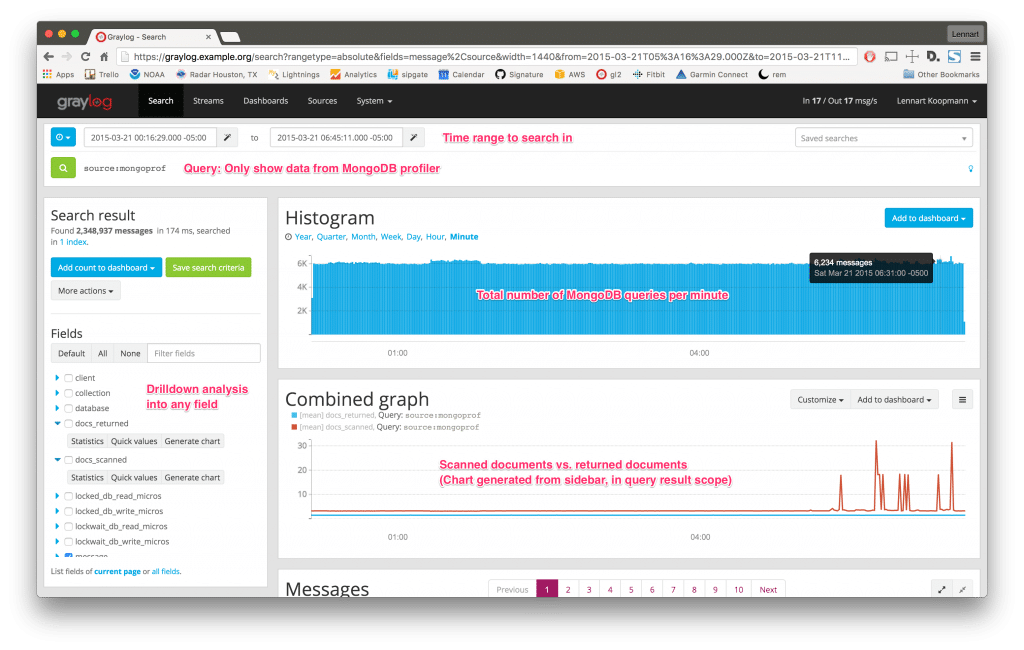
The Combined Graph chart above shows the number of returned documents vs. the number of scanned documents, which was created on the spot using the Fields sidebar. Looking at the spikes in the Combined Graph chart, we can see that the ratio of scanned vs. returned documents doesn’t appear to be normal.
Digging deeper, I extended the search query to only show slow queries (> 5 milliseconds) and found 64 slow queries in the specified time frame:
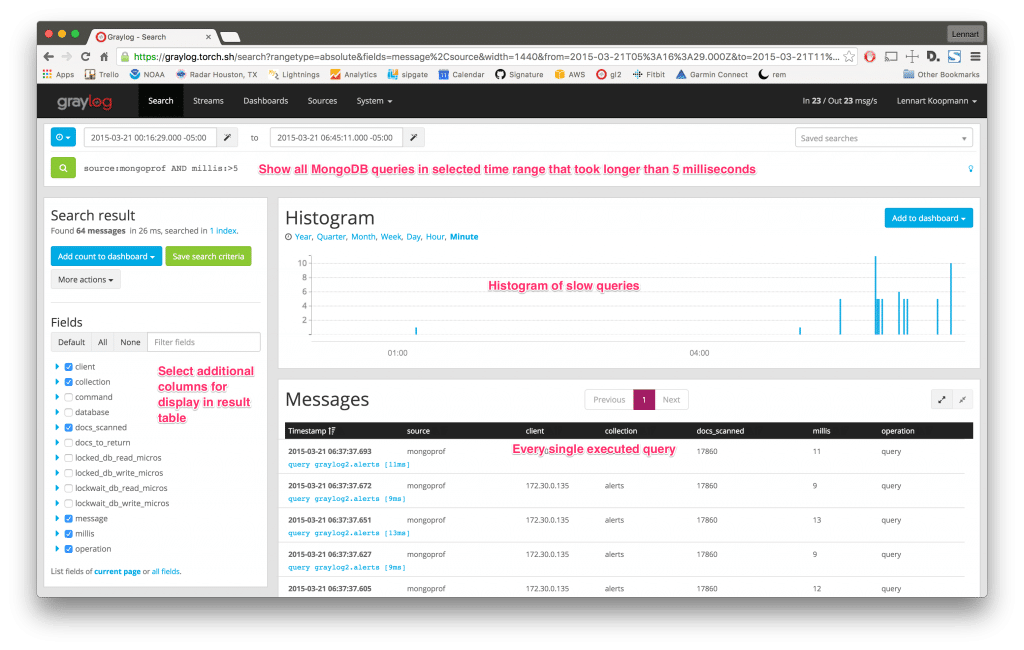
The Fields sidebar was used to select what detailed information to show in the Messages table. You could even sort the table itself on the field millis to show the slowest queries on top. Looking at the Messages table, we see that the slow queries against the alerts collection generally take around 9 to 13 milliseconds and scan 17,860 documents. It seems unusual to request so many documents from the alerts collection at once.
Digging deeper, I clicked on a row in the Messages table to expand more detail:
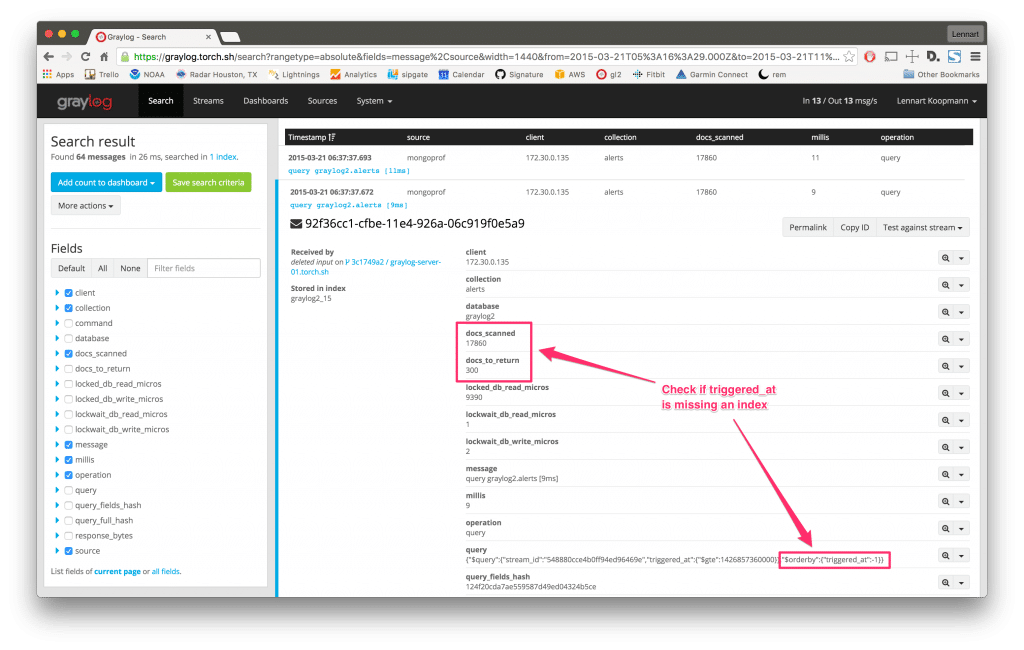
It turns out that 17,860 documents had to be scanned to fulfill the request of a 300 document result set. We see that the query requested 300 documents sorted by the field triggered_at. It appears that the field is not indexed, meaning that MongoDB had to load all documents into memory and manually sort the entire document set.
That concludes this example of how we can easily use the Graylog plug-in for MongoDB to quickly troubleshoot database application performance issues. The example above took me roughly 5 minutes to complete. Now, let’s take it a step further with fingerprinting.
Fingerprinting to identify query types
The Graylog plug-in does much more than just write the pure profiler information. It also fingerprints the queries so you can identify query types instead of exact queries.
Consider a query that is reading user information from MongoDB. It could look like this:
{“email”:”[email protected]”}
{“email”:”[email protected]”}
In the example above, we can see that even for a simple query, the results may vary significantly. This makes it much harder to figure out if a single query or multiple queries are running slow. Hashing the results themselves wouldn’t help either since the hash would be unique for every returned result. Graylog gets around this issue by applying an intelligent fingerprint that returns the same hash for both queries and stores it as the message field queryfieldshash. Querying for that hash in Graylog will return all user lookup queries, no matter which user was requested. This works with multiple fields, nested fields and special query operators too.
With Graylog, you can analyze whether a single slow query is always slow, or if it’s an outlier caused by other factors. Remember the slow queries we found in the example above? Let’s dig deeper into one of the queries by narrowing down the search result to only a specific type of query using the queryfieldshash field:
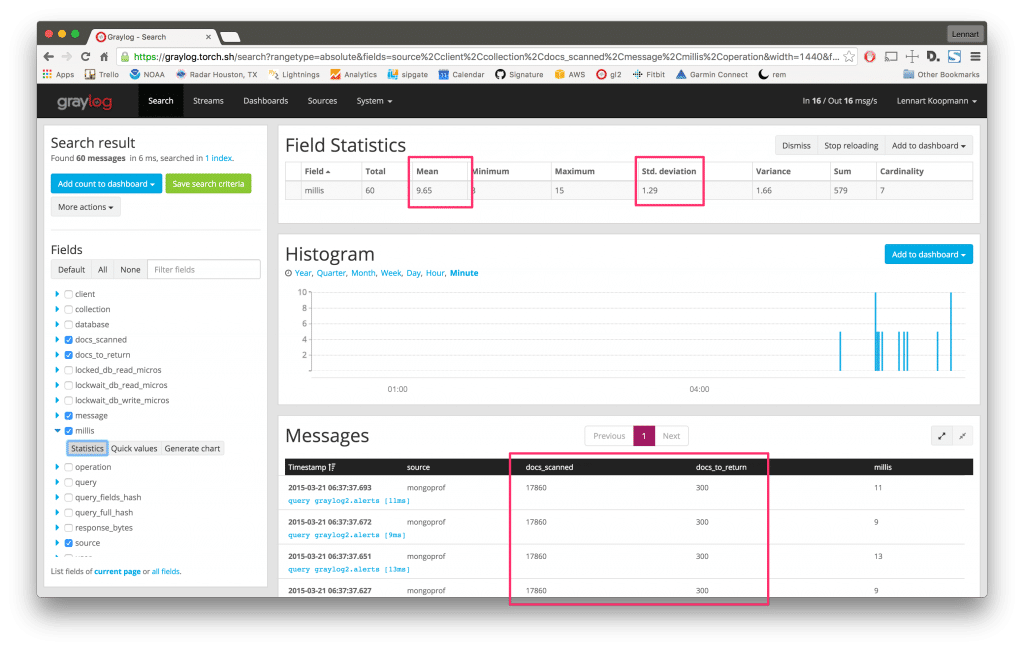
Now all search results and analysis methods are only applying to a single type of query. By analyzing the field millis we can see that the mean calculation time is 9.65ms and the stddev is not very high, indicating that this query is indeed always slow. The search result table is indicating the same. The histogram shows you when exactly this type of query has been executed.
ALERTS
Graylog comes with an alerting feature that you can leverage for MongoDB query monitoring. Whenever there are more slow queries than usual, or even when the standard deviation of a certain query type is too high during a specified timeframe, you can trigger Graylog to perform different actions. Some actions include posting a message to Slack, sending an email, or executing any type of code.
Read more about alerts in the documentation.
CORRELATION
After you master the basics of database application performance monitoring with Graylog, the next step is to send other logs into your Graylog setup to gain visibility into the full application stack.
Add your operating system and network hardware logs in addition to logs from the applications you run. This will enable you to troubleshoot, as one example, why application response time went up after a release. You could use Graylog to check if the MongoDB query execution time went up, which might be the root cause of the application response time increase. Or maybe somebody forgot to add an index to the production database before the release.
OPEN PLATFORM
Graylog is an open platform that allows you to access the stored log information at any time. Use the REST APIs to integrate the aggregated MongoDB data into custom dashboards or forward query information to other systems in real-time over the network.
GET THE GRAYLOG PLUG-IN FOR MONGODB
Click here to get Graylog’s plug-in for MongoDB on the Graylog Marketplace.


