One of the most important events you should be monitoring on your network is failed and successful logon events. What comes to most people’s minds when they think of authentication auditing is OS level login events, but you should be logging all authentication events regardless of application or platform. Not only should we monitor these events across our network, but we should also normalize this data so that we can correlate events between these platforms.
Normalizing, is using a common data schema across all log messages. For example always using the field names user_name or destination_ip to contain those common datapoints. Graylog has already created and published a data schema for us to use in the Graylog Information Model.
In this post we will explore:
- auditing all login events to our Microsoft SQL Servers
- sending those messages to Graylog
- normalizing and enriching those messages so that we can use them inside our existing Graylog illuminate content like dashboards and alerts.
Enabling login auditing on SQL Server
This guide was built using Windows 2019 running SQL Server 2019 standard and SSMS v19 as a reference.
By default, MS SQL server only audits failed login attempts. For best practice, we will want to log all login events to SQL. *You will need to restart the SQL server service to complete these steps:
- Connect to your SQL server from the SQL Server Management Studio.
- Right click on your SQL server in the object explorer (left column) and choose properties.
- Click on the Security tab
- Change Login auditing from “failed logins only” to “Both failed and successful logins”

- Restart the SQL server service
- Perform some successful and failed login attempts to create some messages
- Open the windows event viewer
- Navigate to the “Windows logs > application” log and confirm you can see events 18453 (success) and 18456 (failure).
Prepare to transform the data in Graylog to use with illuminate
Before we send the audit messages into Graylog we first want to create a normalization and enrichment pipeline so that the data from the messages can be transformed to live alongside other Illuminate parsed data. This will allow our SQL audit events to be displayed inside Illuminate dashboards or used in Illuminate alerts (you can see an example of this at the end of the article).
If you are using the open source version of Graylog this step is not required, but it is highly recommended to use at least the first section of this pipeline rule to normalize your log data to the Graylog Information Model to allow searching across log types.
We are going to create a simple pipeline with a single rule in stage 0 to accomplish this. First create and save a new pipeline rule using the following code:
rule "Sample SQL audit Login normalization"

when
//run the rule when it is a sql login audit event
    $message.winlogbeat_event_code == "18456" OR $message.winlogbeat_event_code == "18453"

then
//populate the GIM outcome (success or failure)
    set_field("event_outcome", lowercase(to_string($message.winlogbeat_event_outcome)));

//set the GIM user_name field
    set_field("user_name", lowercase(to_string($message.winlogbeat_winlog_event_data_param1)));

//set the GIM type (normally logon)
    set_field("gim_event_type", lowercase(to_string($message.winlogbeat_event_action)) );

//set the common GIM fields that we need to appear in the correct dashboards as an authentication event
    set_fields({
      gim_event_category: "authentication",
      gim_event_subcategory: "authentication.logon",
      gim_event_type_code: "100000",
      application_name: "ms sql server",
      event_source_product: "ms sql server",
      event_source: $message.source

     });

//move our message to security stream where other windows logon events are stored
    remove_from_stream(name:"Illuminate:Windows Event Log Messages");
    route_to_stream(name:"Illuminate:Windows Security Event Log Messages", remove_from_default: true);

end
Next Create a new Pipeline. Attach the pipeline to the appropriate streams (if you are using Graylog Illuminate this will be the “Default Stream” and “Illuminate:Windows Event Log Messages”). Then assign the rule you just created to stage 0 and save your changes.
Collect SQL audit messages from the Windows application log
Now that we have the logs being generated to track the SQL login events, and we are ready to transform them, we need to get those log messages into Graylog.
If you have not ingested beats agent data into Graylog before make sure your cluster is setup to receive the traffic from winlogbeat with a beats input
Download and install winlogbeat 7.x to the server (version 7 is the version of Winlogbeat that is currently deployed with Graylog sidecar, so we will not be using version 8 in this guide)
Below is the minimum winlogbeat.yml that you will need to use to collect these events.
output.logstash:
  hosts: ["GRAYLOGSERVER:5044"]

winlogbeat.event_logs:
  - name: Application
    ignore_older: 48h
    event_id: 18453, 18456
If you are already collecting logs from this host, just add this section to your existing winlogbeat.yml file.
winlogbeat.event_logs:
  - name: Application
    ignore_older: 48h
    event_id: 18453, 18456
Once you have updated the configuration file make sure to start or restart the winlogbeat service to apply the new configuration.
View this data inside your Graylog Security and Illuminate dashboards
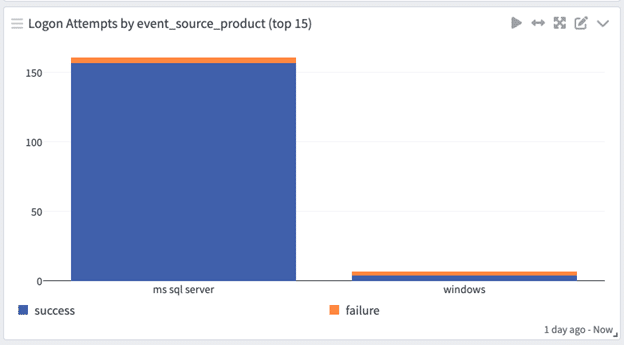
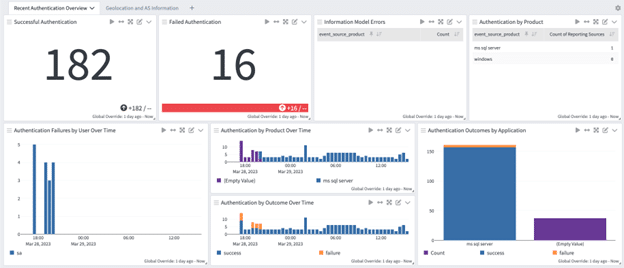
If you are a Graylog enterprise customer your SQL audit messages are now integrated into your Illuminate and Security authentication dashboards.
If you are using Graylog Security the SQL authentication events will display and the Security Overview and User Activity Dashboard.
Security User Activity Dashboard


On either Graylog Security or Graylog Operations with the Illuminate Core spotlight pack installed you can see these authentication events on the Enterprise Authentication Dashboard and the User Account Investigation Drill Down Dashboard.

Now you can see the value of taking the steps to integrate these log messages into your other Illuminate enriched messages to give you visibility into all authentication requests across your network. Parsing into the Graylog Schema will automatically update your dashboards with messages being visualized into Illuminate Dashboards.


