If you’ve ever watched one of those rehabilitating a business show like Kitchen Nightmares, you know that the advice is often the same, “Don’t try to be everything to everyone. Pick what you’re good at and stick with it.” Essentially, the message is to pick your niche and be the best within it. For example, a large chain restaurant like Cheesecake Factory might have a twenty page menu that includes chicken parmigiana, but the best chicken parmigiana is probably that small local Italian place with red and white checkered tablecloths.
In technology, this same premise holds true which is why most corporate IT infrastructures include various technologies. In a business world that runs on Software-as-a-Service (SaaS) applications, the application servers you choose directly correlate to your organization’s operational uptime and security posture.
By understanding what NGINX (pronounced “engine ex”) is and some fundamental use cases, you can determine whether it’s appropriate for your environment.
What Is NGINX?
Although NGINX began its life as an open source web server software, its capabilities have expanded to include:
- Reverse proxy
- Cache
- Load balancing
- Media streaming
- Email proxy server (IMAP, POP3, and SMTP)
Originally developed by Igor Sysoev in the early 2000s, NGINX solved the problem that existing web servers had handling large numbers of concurrent connections, dubbed C10K. As internet connectivity became more important to business operations, NGINX’s ability to optimize performance with low resource usage.
Compatible with various operating systems, NGINX stays true to its roots by maintaining an open-source web and application server and a free monitoring tool. The explosion of web applications has led the company to expand with the following paid offerings:
- An all-in-one load balancer, reverse proxy, web server, content cache, and API gateway
- An ingress controller for managing Kubernetes traffic that includes an API gateway, identity, and observability features
- A Web Application Firewall (WAF)
- Management tools
How Does NGINX Work?
NGINX uses an asynchronous, event-based architecture so it can handle multiple requests within one thread. Since each thread responds to multiple connections or sessions, it efficiently handles multiple concurrent connections.
If you’ve ever been to an amusement park (think Disney or Six Flags), you know that the lines can be long, especially at the height of the season. Assuming that the same number of guests are in a line, the ride for a line with one car that holds 50 guests will move faster than a line with 30 cars that hold one guest each.
Like a single car that can hold 50 guests makes the line move faster, NGINX’s ability to consolidate multiple requests with one thread makes it a faster web server.
How is NGINX Different From Other Web Servers?
Other servers, notably Apache, are process-based making them similar to the one car that holds a single guess, like bumper cars. These servers create a new process for every request on every connection. After completing one request, they move on to the next.
If you’ve ever waited in line for bumper cars or go karts, you know it’s a long wait between turns. If you have 10 people online for 10 cars, the wait won’t be that long. If you have 20 people in line for 10 cars, the people at the end have to wait through one other group of guests. If you suddenly get 100 people in line for the 10 cars, the line takes exponentially longer for the people at the end.
Similarly, servers that take a process-based approach are resource-intensive which can slow down connectivity or lead to traffic bottlenecks.
NGINX Use Cases
If you’re considering whether to implement NGINX in your environment, the following are some of the use cases where it provides greater value.
Serving Static Content
Since NGINX can manage multiple requests at once, it excels at serving static content, like HTML, CSS, JavaScript files, and images. Its auto-indexing features make retrieval and display of static content even faster, enabling it to locate and serve content by efficiently routing requests. For websites and applications that have large static files, the capability reduces latency.
Load Balancing Across Multiple Servers
NGINX acts as an efficient HTTP load balancer for distributing traffic to several application servers, enabling you to improve application performance, scalability, and reliability. You can set up NGINX as a single entry point for a web application that works across multiple distributed servers. When you set it up to listen to certain connections and redirect traffic, its ability to take in high volumes of requests and route them effectively enables it to act as a load balancer. Although the default load balancing configuration uses a round-robin algorithm, you can change the configurations to use either the least connections or IP hashing methods.
Reverse Proxy Server
Since a reverse proxy server intercepts, processes, and forwards requests to the right backend server, NGINX’s original design for high volumes of concurrent connections makes it an excellent candidate. Additionally, many reverse proxy servers perform load balancing which means that using NGINX can give you the two-for-one capability. Many IT teams deploy an NGINX as a reverse proxy in front of an Apache web server to improve security and performance.
NGINX Monitoring Best Practices
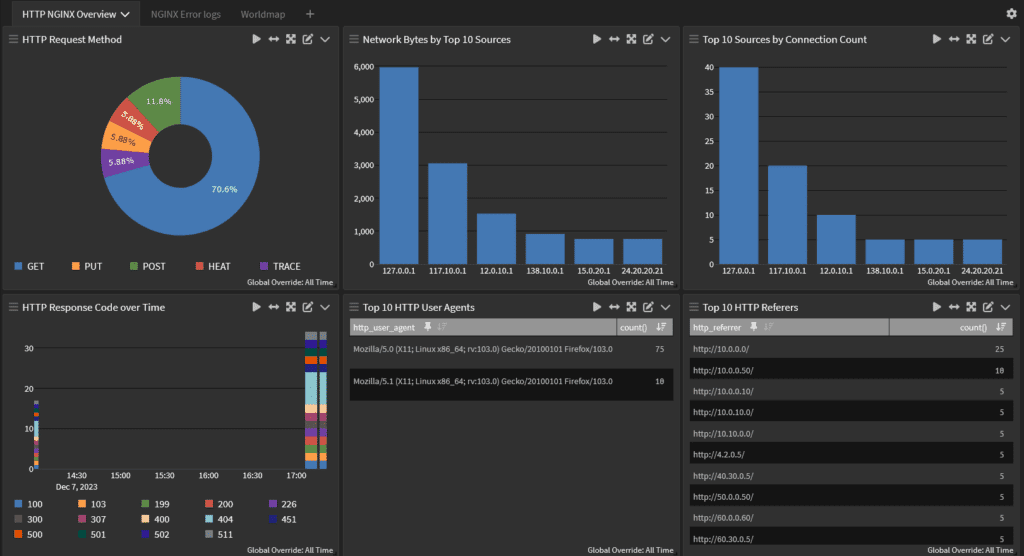
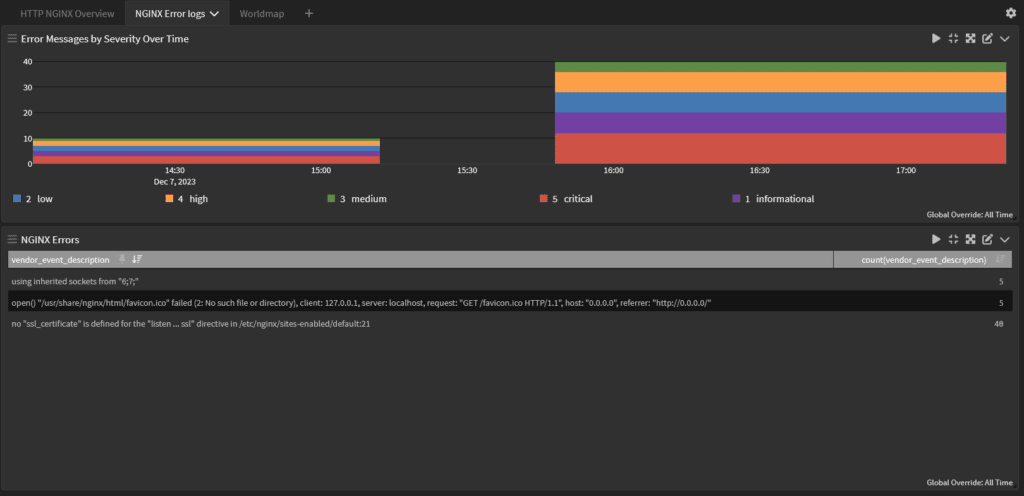
Although NGINX provides a Management Suite Instance Manager that enables you to view events and metrics about your instances, using only this tool limits your visibility. If you’re not correlating your NGINX server log data with the other technologies in your environment, you have blind spots that can lead to service interruptions or security incidents. Many metrics used to monitor your web server’s performance can help you detect a security incident when correlated with data from across your environment.
Requests per second
Requests per second divides the number of requests received during a time period, typically between one and five minutes. At a performance level, this metric tells you whether your server is handling requests in a timely manner or is overloaded. Simultaneously, if you want to identify security events like brute force attacks or distributed denial of service (DDoS) attacks, you want to correlate data with events like:
- Failed login attempts
- Firewall logs
- Intrusion detection system (IDS)/Intrusion prevention system (IPS) logs

Uptime
If your server goes down, people can’t access the application, meaning employees can’t do work and customers have a poor experience. While 100% uptime is ideal, a baseline performance metric should be 99% or better. From a security perspective, a server taken offline could indicate:
- Attackers gained unauthorized access to the server.
- A DDoS overwhelmed the server, leaving it unable to process requests.
By correlating your uptime data with other network activity log data, you can route any issues to the right team more efficiently.

Error rates
The error rate metric tells you the percent of requests that failed or didn’t receive a response. At an operations level, error rates can indicate an application bug that needs to be fixed. From a security perspective, failed requests can indicate a DDoS as the overloaded server can no longer respond to all requests. Correlating error rates with requests’ geographic data can give you insight into whether the issue is from known risky locations or not.

Thread Count
Although NGINX can handle multiple requests within a thread, each thread is still a process running on the server. Typically, you want to configure a maximum number of threads per process so that the server puts requests on hold if it goes over that value. At a security level, malware often runs unknown and unexpected processes in the background, meaning that thread count could provide insight into a potential infection. By correlating data from resources like VirusTotal with your server monitoring data, you can identify potential malware running on your server.
Graylog: Centralized Log Management for Monitoring NGINX Server Performance and Security
With Graylog Security, built on the Graylog platform, you get centralized log management that gives you the “two for one” operations and security tool you need. Graylog Security delivers high-fidelity alerts with a lightning-fast search speed that reduces investigations by hours, days, and weeks. See our documentation for integrations with NGINX
Using Graylog, you have the functionality of a Security Information and Event Management (SIEM) tool without the complexity and cost that usually come with them. With our easy-to-use interface and cloud-native capabilities, you reduce the overall total cost of ownership. You save money by leveraging cloud storage capabilities while eliminating the need to hire or train security team members who can use a proprietary query language.


