It’s been a long few years for your IT department. In the span of one month, you had to make sure that all employees and contractors could work remotely. This meant giving everyone access to all cloud resources and ensuring uptime. Then, you needed to start securing access. Now, you need to shore up all your security as the phrase “zero trust architecture” has recently entered conversations with leadership.
Part of securing your company’s environment is securing the networks while making sure that employees don’t get frustrated with latency. This is where you can turn to your centralized log management solution to help with network monitoring.
HOW DO YOU MANAGE LOGS?
Your event and security logs will tell you a lot about what’s happening on your networks. Every application, networking device, end-user device, server, and end-user generates log files for every action taken. The information collected in an event log can include things like:
- User or device IP address
- Date
- Type
- Event type
- Issue type
Your event and security logs document all activities across on-premises, multi-cloud, and hybrid environments, making them useful for both IT operations and security teams. On the other hand, your environment generates a lot of logs, and they’re often in different formats.
Within your IT environment, you also have a lot of interconnected services, like on-premises and Software-as-a-Service (SaaS) applications. Across these complex environments, especially with a distributed workforce, just monitoring your logs isn’t going to help you. You need to correlate events across users, endpoints, networks, and resources.
A centralized log management solution gives you a way to manage your logs through:
- Collection
- Parsing
- Normalization
- Aggregation
- Correlation
- Analysis
HOW DO YOU IMPLEMENT CENTRALIZED LOGGING?
Every company is different, so your implementation may look different from someone else’s. However, no matter which log analysis tool you choose, you will go through a similar process.
Your implementation is going to follow a lot of your security best practices. You need to identify critical systems and resources, like:
- Operating systems
- Database software
- Application software
- Intrusion Detection Systems/Intrusion Prevention Systems (IDS/IPS)
- Network Devices
- Servers
- Workstations
- DNS
- Web proxies/gateways
- LDAP/Active Directory
After connecting the sources, you define which data you want from the logs, also called parsing. Usually, this includes data like:
- User ID
- Date
- Time
- Account Logon events
- Geolocation
- Account management
- Object Access
- Privilege use
- Policy change
- Process tracking
- System events
With all this data, the centralized log management solution usually does the work in the background to normalize the data to correlate the events. The event correlation and analysis is where the security monitoring magic takes place because it allows you to connect the information in a way that tells a story.
For example, if you connect a user ID and device to an IP address combined with firewall data to understand whether the user is connecting from their usual location and using the data in their normal way.
WHERE DOES NETWORK MONITORING FIT INTO A ZERO-TRUST ARCHITECTURE?
Most likely, your company is already putting many of the zero trust architecture requirements in place. For example, Denial of Service (DoS) attacks represented 46% of the top Action varieties in Verizon’s 2022 Data Breach Investigations Report. However, perusing the National Institute of Standards and Technology (NIST) Special Publications (SP) never hurts.
According to NIST SP 800-207 section 3.4.1, the network security requirements that support a zero-trust architecture are:
- Network connectivity with basic routing and infrastructure
- Ability to distinguish between enterprise-owned/managed assets and devices’ current security posture
- Recording packets on the data plane and filtering out metadata about the connection to dynamically update policies as part of evaluating access requests
- Denial of arbitrary incoming connections from the internet
- Logically separating the data plane and control plane
- Providing a way for enterprise assets to access the policy enforcement point (PEP)
- Requiring all enterprise business process traffic to pass through one or more PEPs
- Providing access to enterprise resources without requiring a link back to the enterprise network first
- Provisioning the components for the expected workload or ability to scale infrastructure to handle increased usage
- Basing access on policies or observable factors, like geolocation, network location, or device type
To implement a zero-trust architecture, you will need a way to monitor network traffic while also bringing together data about endpoint security and user access monitoring. The right centralized log management solution can give you all of this.
WHAT IS NETWORK LOG ANALYSIS?
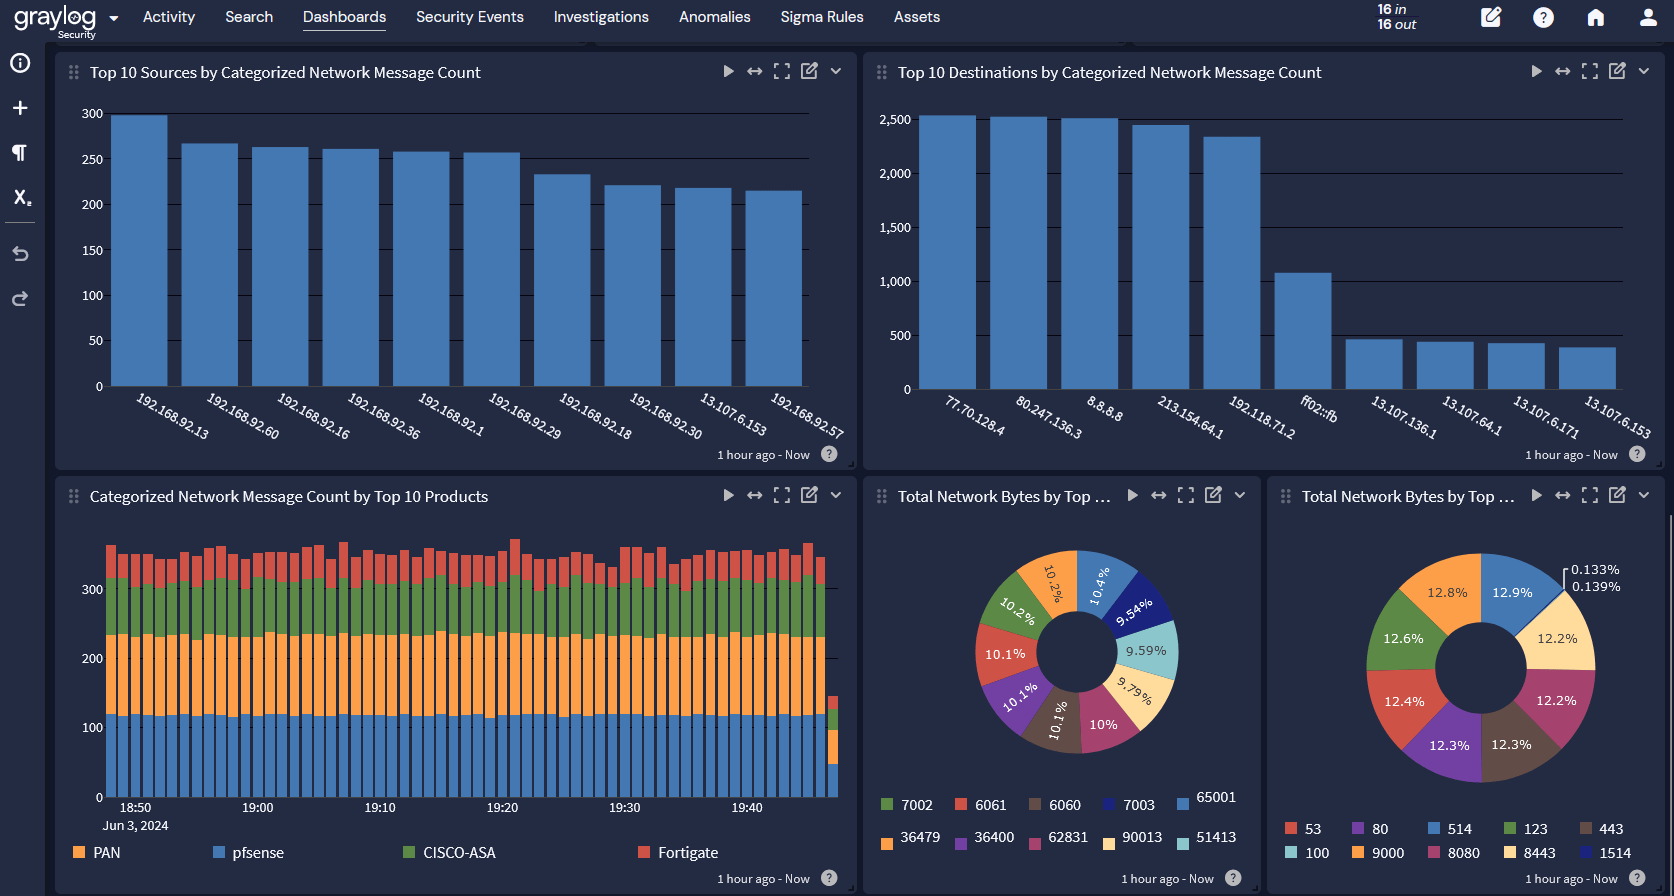
Network log analysis is the process of collecting, aggregating, and correlating log data for visibility into system performance and security posture. Some of the log sources include network devices and technologies like:
- Hubs
- Switches
- Routers
- Bridges
- Gateways
- Modems
- Repeaters
- Access Points
- Firewalls
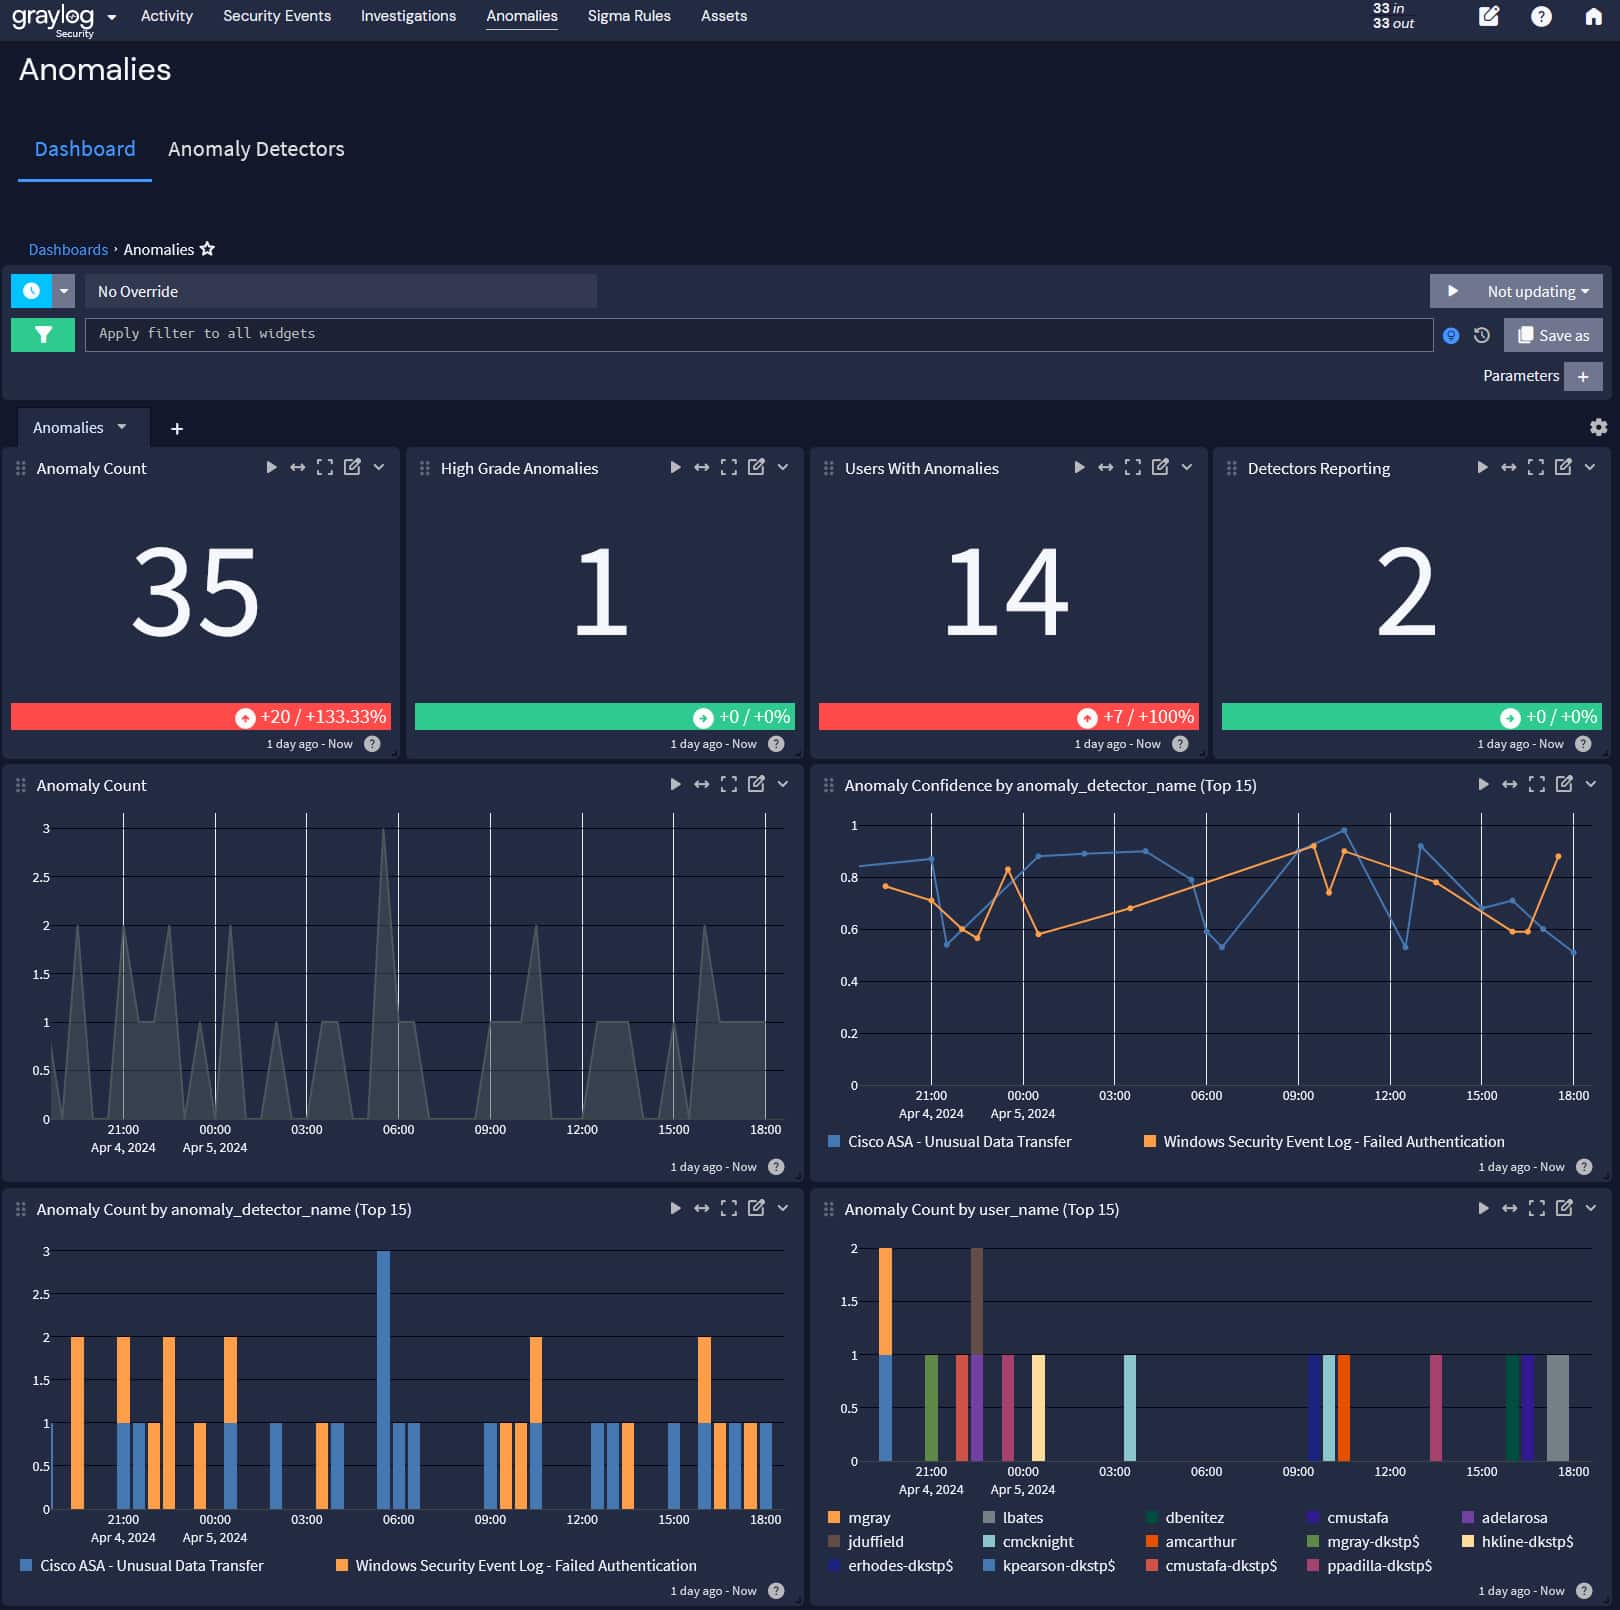
As part of the correlation analysis, your log management solution can use machine learning to bring together to find anomalies in the data so that your security team can detect, investigate, and remediate security incidents.
USING CENTRALIZED LOG MANAGEMENT FOR NETWORK MONITORING
You can use your centralized log management solution to monitor your networks as part of your security and zero trust architecture strategies. Your IT operations team is probably already using a centralized log management tool to detect service performance issues. If the technology includes security use cases and data analytics, you can get a “two for one” that maximizes the investment.
FIREWALLS
Your firewalls define the allowed inbound and outbound traffic. Many firewalls connect user devices and IDs to their source IP address, so collecting and analyzing this data at the network perimeter tracks end-user behavior. Monitoring inbound traffic can help you identify potential security risks like compromised credentials. Meanwhile, monitoring outbound traffic can help you identify suspicious activity like data traveling to a server that a cybercriminal controls.

Intrusion Detection Systems (IDS)/Intrusion Prevention Systems (IPS)
Many companies use an IDS or IPS as part of their network monitoring. On its own, the IDS/IPS data tells you that the packets match or don’t match a known attack pattern. Your IDS/IPS does the packet inspection and pattern detection that can tell you about potential evasion techniques, like whether a cybercriminal is:
- Sending fragmented packets
- Sending traffic to a different port after reconfiguring a protocol
- Scanning the network
- Attempting to obscure the source of the attack
Your centralized log management solution can correlate your firewall data that links traffic to the source IP with the IDS/IPS event data. By linking the “where” or “who” from the firewall data to the “what” from the IDS/IPS, you have a more complete story.
Traffic volume anomaly detection
Your firewall is sending you statistics about the traffic entering and leaving. As part of network monitoring, you need to set baselines for what “normal” traffic looks like. This way, you understand what abnormal or high traffic volumes look like.
In this case, your centralized log management solution can help when it incorporates machine learning. Establishing a network traffic baseline in most environments is difficult because people send data across your networks all day long. Machine learning applies the math to the traffic by monitoring over time so that you can gain visibility into how everyone is using resources.
For example, when running an analysis tool, a finance team might have increased network traffic at the beginning of the month. You need to include increased usage during that period as part of your baseline. If you don’t, your finance team will look like they have an abnormally high traffic volume during that period every month, and you will be investigating false positives.

When your centralized log management solution has machine learning and anomaly detection capabilities, you can create higher fidelity alerts that combine firewall, IDS/IPS, and traffic volume that reducing the number of security incident false positives.
Graylog Centralized Log Management for Network Monitoring
With Graylog Security, built on the Graylog platform, you get centralized log management that gives you the “two for one” operations and security tool you need. Graylog Security delivers high fidelity alerts with a lightning-fast search speed that reduces investigations by hours, days, and weeks.
Using Graylog, you have the functionality of a Security Information and Event Management (SIEM) tool without the complexity and cost that usually come with them. With our easy-to-use interface and cloud-native capabilities, you reduce the overall total cost of ownership. You save money by leveraging cloud storage capabilities while eliminating the need to hire or train security team members who can use a proprietary query language.


