Once you have Graylog fully up and running, it’s best to implement a plan for monitoring your system to make sure everything is operating correctly. Graylog already provides various ways to access internal metrics, but we are often asked what to monitor specifically. In this post, we’ll provide a list of both host and Graylog metrics that you should monitor regularly as well as a guide on how to access the data.
Host metrics
It is critical to monitor metrics that are coming directly from the hosts where you are running your Graylog infrastructure. The core set of metrics below should always be in acceptable parameters and never grow over extended periods without going back to normal levels.
These metrics are important to keep in check as they will tell you when it’s time to scale out vertically or horizontally. Simply apply the same monitoring methods you use for other systems. Nothing special to think about for Graylog here.
Of these five core metrics, we’d like to note the importance of monitoring available disk space. You will run into serious trouble if Graylog or Elasticsearch runs out of disk space. Make sure the journal size and data retention settings are supported by enough disk space at all times.
UDP receive errors
If you are using UDP as transport protocol for any log source, you should also monitor for UDP receive errors. In a server system, there is no way to signal a UDP source that a message could not be processed, meaning some UDP messages might silently be lost. For example, this can happen if the kernel UDP receive buffers are filling up because incoming messages are not handled fast enough.
In Graylog, this can happen if the system is overloaded and it cannot handle the incoming throughput.
Good news though! An operating system will at least report on discarded messages. On Linux systems you can check it like this:
$ netstat -us
Udp:
781024 packets received
500896 packets to unknown port received.
0 packet receive errors
201116 packets sent
As you can see in this case, we’ve had zero packet receive errors, which is good. In general, most monitoring tools will have a predefined collector setting to monitor packet receive errors. Be sure to monitor this metric.
Graylog metrics
Another important technique is to monitor certain internal Graylog metrics. We are constantly instrumenting hundreds of sections in the code, together with higher level metrics, about system performance. Those metrics can be accessed through the REST API, a JMX connector, or forwarded to monitoring services like Datadog, Prometheus, Ganglia, Graphite or InfluxDB using our metrics-reporter plugin.
No matter how you collect and monitor the metrics, you’ll need to know what metrics to watch out for. A list of metrics follows, but let’s first talk about ways to access the data.
You can get a quick overview of all metrics directly from the Graylog Web Interface by navigating to System / Nodes and then hitting the Metrics button of a graylog-server node.
Programmatic access for integration with monitoring systems is provided through the REST API and JMX.
Accessing the metrics through the REST API
A good way to access the internal Graylog metrics is to call the graylog-server REST API. The most important call is:
/system/metrics/{metricName}
Example response:
$ curl -XGET http://USER:[email protected]:9000/api/system/metrics/org.graylog2.filters.StreamMatcherFilter.executionTime?pretty=true
{
“count” : 221007316,
“max” : 0.016753139,
“mean” : 7.077989625236626E-4,
“min” : 5.1164E-5,
“p50” : 3.15399E-4,
“p75” : 7.4724E-4,
“p95” : 0.0036370060000000004,
“p98” : 0.005530416000000001,
“p99” : 0.006540015000000001,
“p999” : 0.009013656,
“stddev” : 0.0013025393041936433,
“m15_rate” : 188.38619259079917,
“m1_rate” : 484.7011237137814,
“m5_rate” : 245.58628772543554,
“mean_rate” : 156.69669761808794,
“duration_units” : “seconds”,
“rate_units” : “calls/second”
}
Note that your REST API path and port might be different. It’s configured in your graylog-server.conf configuration file but the same port as the Web Interface and /api prefix is the default since Graylog v2.1. (Before that it was no prefix and port 12900)
Other metrics API endpoints can be explored through the REST API browser in the Graylog Web Interface.
Accessing the metrics through JMX
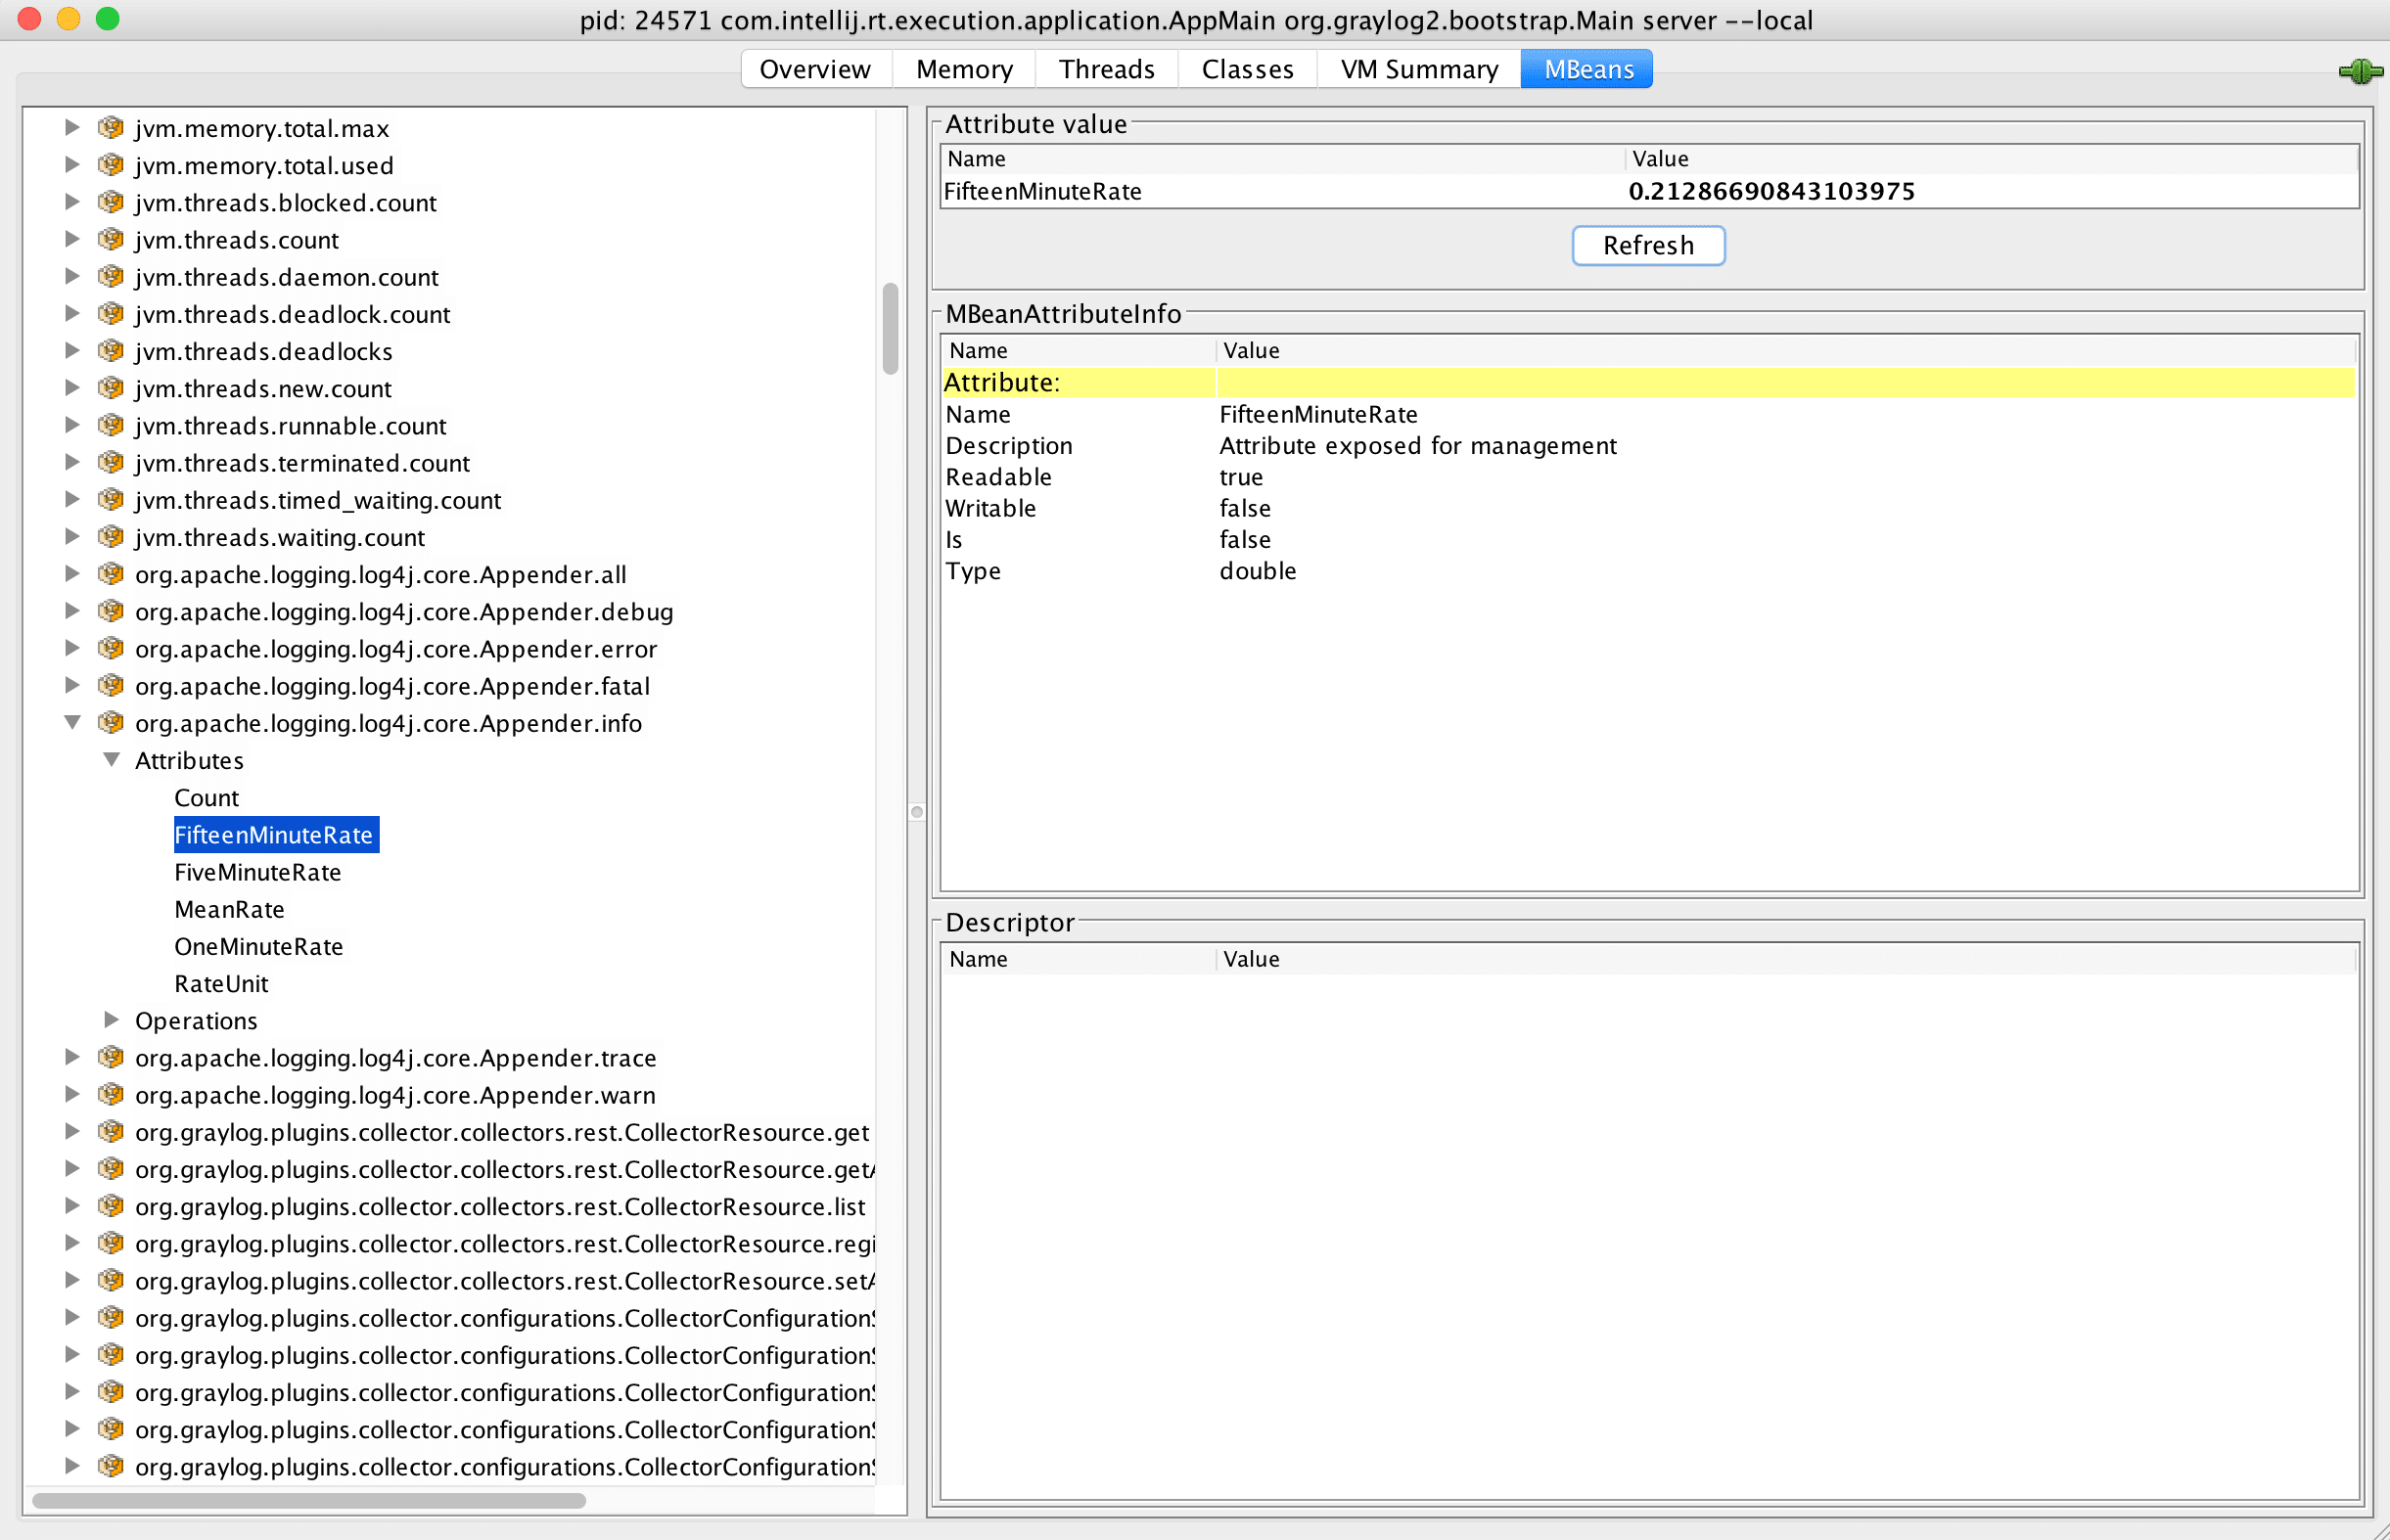
Graylog also exposes all internal metrics through JMX. Many monitoring tools support this and it’s a very viable option to choose, especially if you are already monitoring other Java applications in your environment.

Internal log messages
This one is great. We are exposing the rate of internal log messages (the log messages that Graylog writes about it’s own process), broken down by the log level. You’ll get 1, 5 and 15 minute rates of TRACE, DEBUG, INFO, WARNING, ERROR and FATAL log messages. If anything is wrong with Graylog, the WARNING, ERROR or FATAL message rates will be elevated. Monitor this for high level system health metrics.
The metrics have the following names:
- org.apache.logging.log4j.core.Appender.trace
- org.apache.logging.log4j.core.Appender.debug
- org.apache.logging.log4j.core.Appender.info
- org.apache.logging.log4j.core.Appender.warn
- org.apache.logging.log4j.core.Appender.error
- org.apache.logging.log4j.core.Appender.fatal
The journal size
The Graylog journal is the component sitting in front of all message processing that writes all incoming messages to disk. Graylog then reads messages from this journal to parse, process, and store them. If anything in the Graylog processing chain, from input parsing, over extractors, stream matching and pipeline stages to Elasticsearch is too slow, messages will start to queue up in the journal.
You should monitor the journal size to make sure it is not growing unusually fast. The metric you want to look at is:
- org.graylog2.journal.entries-uncommitted
Filter execution times
A common problem that can hit performance or bring message processing to a halt completely is when someone configures a regular expression or other rule that is too CPU expensive or simply never finishes. Monitor the internal filter processing times to spot anomalies and be able to perform faster root cause analysis.
The processing filter execution time is recorded in this metric:
- org.graylog2.shared.buffers.processors.ProcessBufferProcessor.processTime
There is no general good or bad threshold because processing times depend on your hardware and configured stream rules, extractors pipeline rules and other runtime filters. You can collect this metric for a set period of time and then make your own decision about what the upper threshold should be. An abrupt increase in processing time means that someone configured an expensive runtime filter rule.


